Day 14 · Borgesian map · Sources and method
The lake that came back, for a few weeks.
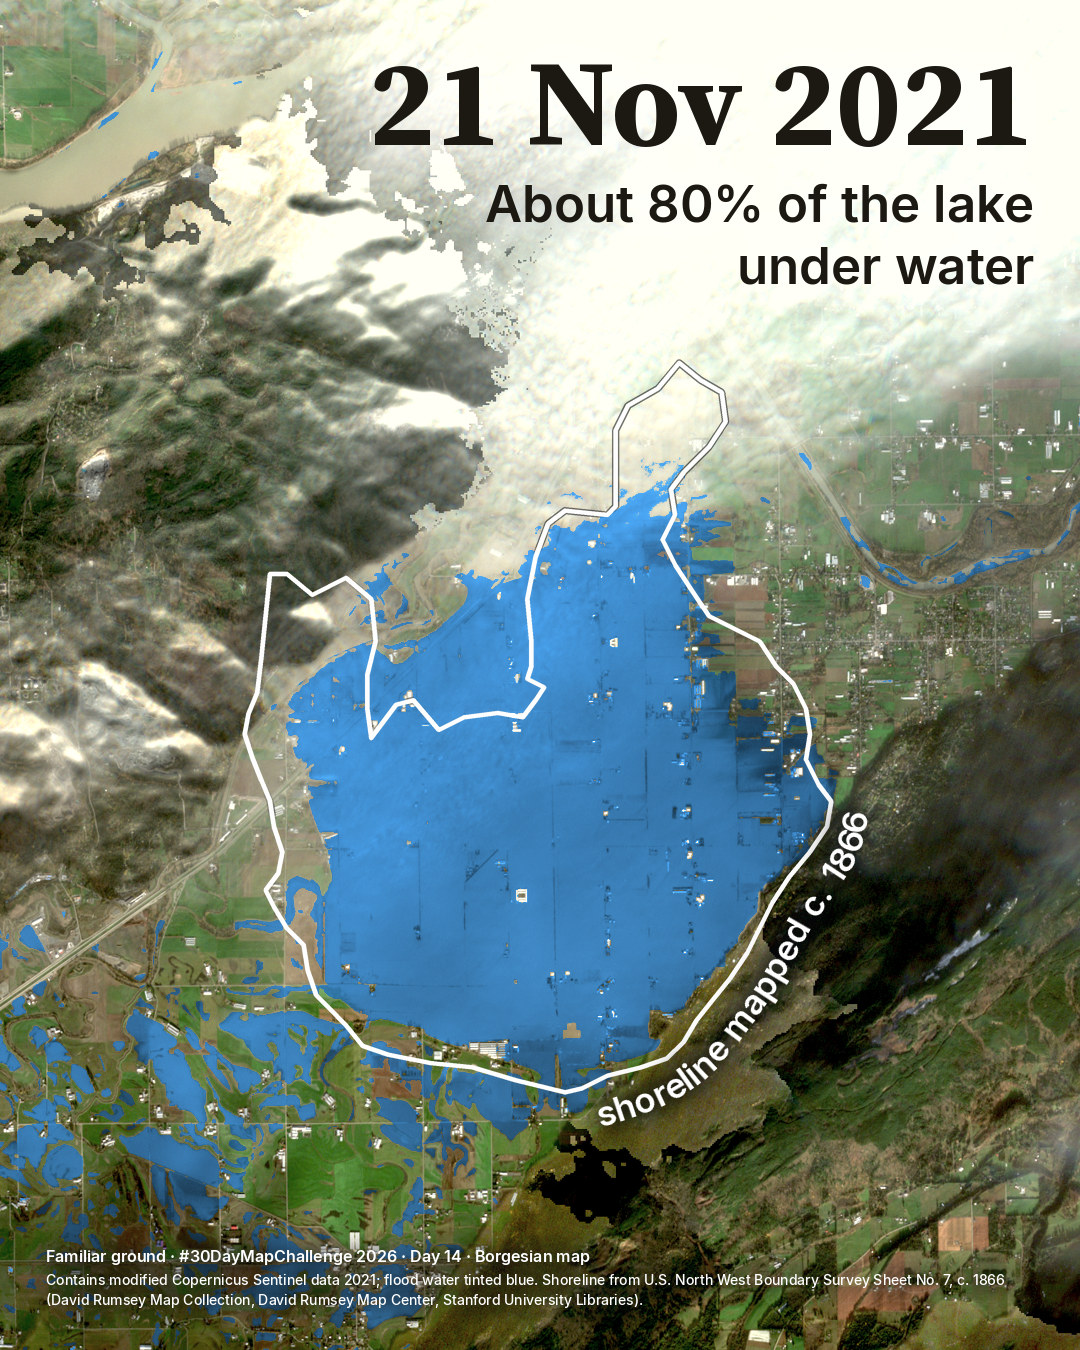
Sumas Lake was drained in the early 1920s. On 21 November 2021 about 80% of the lake, as a survey map of c. 1866 shows it, was under flood water. This page gives the sources, the method, the checks, the limits and the credits.
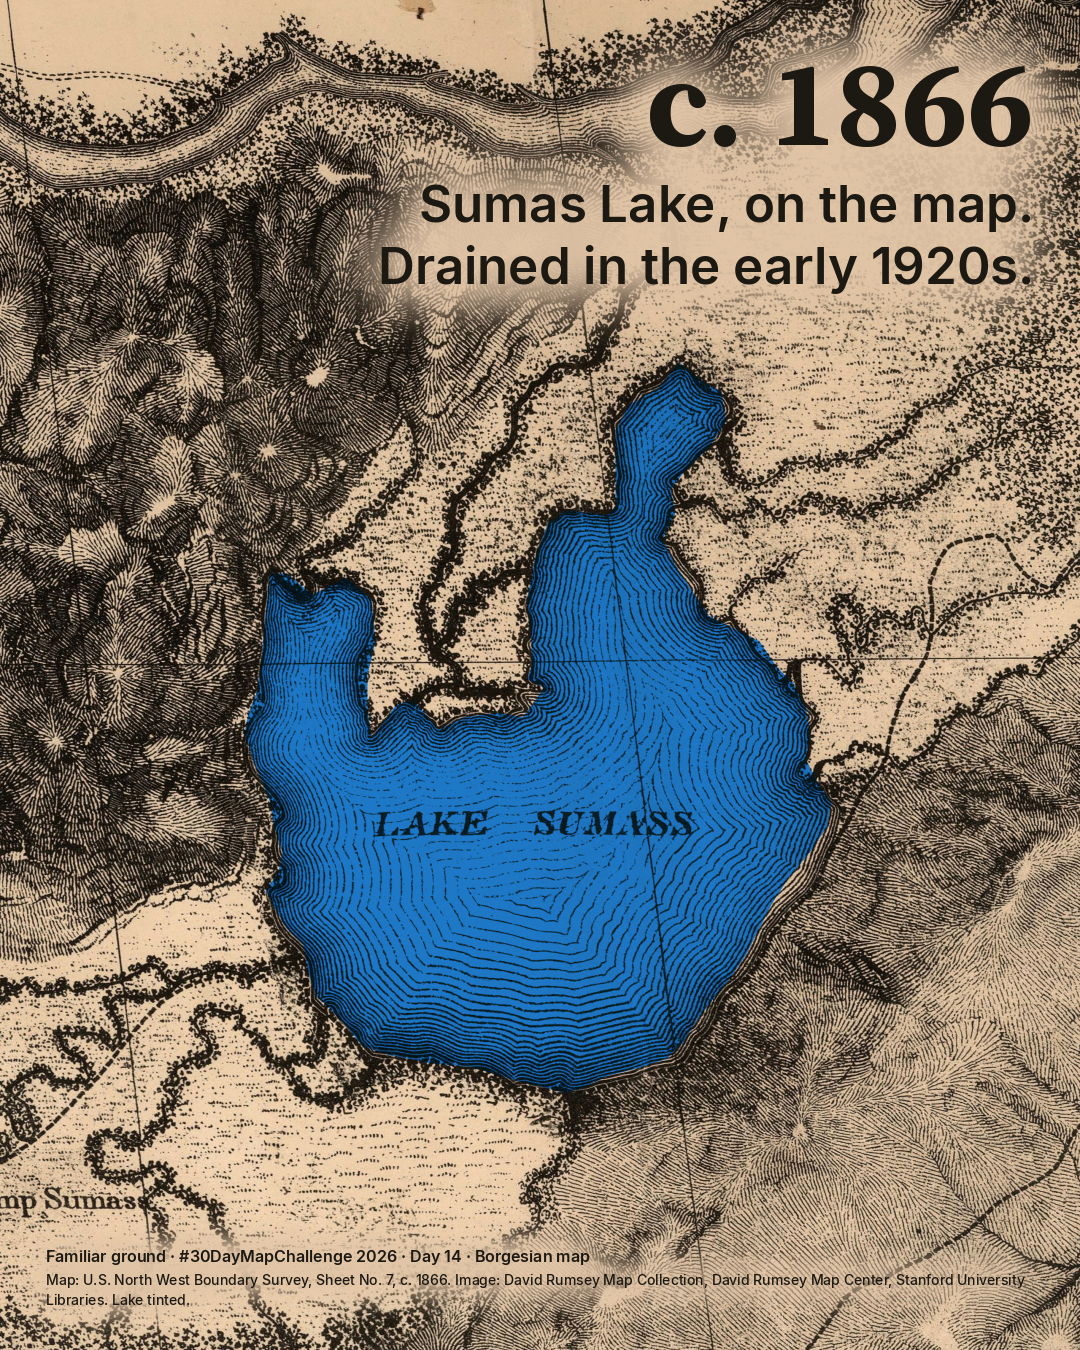
I started from a survey map printed about 1866. On it, Sumas Lake lies where Sumas Prairie is today, in Abbotsford, British Columbia. The lake was drained in the early 1920s to make farmland, and for about a century it survived mainly on old maps and in memory. It lay in the traditional territory of the Semá:th people. Sumas First Nation calls it Semá:th Xó:tsa.
In mid-November 2021, after an atmospheric river, flood water returned to much of the old lake bed. I fitted the old map to the ground and laid its shoreline over a satellite photograph from 21 November 2021. About 80% of the lake the surveyors drew was under water that day, and nearly nine tenths of the main body of flood water lay inside their shoreline.
For the people who live and farm there it was a disaster. More than 3,300 people in Abbotsford were told to leave their homes, and the prairie flooded again in December 2025. The map shows where the water lay on one day. It says nothing about what should happen next.
The old lake
Source and method
U.S. North West Boundary Survey, Sheet No. 7, scale 1:60,000, surveyed 1857-61, printed c. 1866. Image: David Rumsey Map Collection, David Rumsey Map Center, Stanford University Libraries.
The sheet was fitted to today's ground on 14 points that have not moved (mountain feet, Cultus Lake, the border). It is good to about 300 m, except the north-west arm, which the sheet draws up to 600 m onto the mountain foot. The outline is the engraved edge of open water, 32.7 km2.
The 1860s survey spelled it "Lake Sumass"; today it is Sumas Lake.
The flood
Source and method
A Sentinel-2 photograph of 21 November 2021, three to four days after the largest extent. Contains modified Copernicus Sentinel data 2021. The flood water is tinted blue; in true colour it is silt brown. The blue follows the water map made from the photograph alone. Where cloud hides the ground it is left unpainted, and the water under it, seen by Sentinel-1 radar, is counted in the number but not shown.
The number
Checks
82% with the standard way of separating water from land; 73 to 77% with stricter cuts; 80 to 83% if the old map is moved by its fit error. So about 80%, give or take a few points. Radar alone, which sees only open water, gives 58 to 72% between 17 and 22 November. Flood water outside the old shoreline, mostly on fields to the south-west, is in the second picture too.
Limits
It is the lake as surveyed some 60 years before it was drained, at one season. In spring the lake was much larger. This outline is a low-water lake, and no 1920s shoreline could be obtained.
Another outline, drawn from surveyors' notebooks of the mid-1800s (Finn et al. 2024), is nearly twice as large; against it the share would be much lower, roughly 45% to 70% by simple arithmetic. It was not measured here.
21 Nov is not the peak, and the second digit of 82% is not solid.
Earlier overlays
This is not the first overlay of the old lake on this flood: The Tyee (2021) and Raincoast Conservation Foundation (2023) mapped it, Finn et al. (2024) showed it, and Lu et al. (2026) measured the flood inside the dikes.
Credits
- Map image
- David Rumsey Map Collection, David Rumsey Map Center, Stanford University Libraries (list no. 2889.007).The collection's own terms: credit required, no facsimiles for sale
- Satellite
- Contains modified Copernicus Sentinel data 2021.Copernicus Sentinel data terms
- Sentinel-1 radar
- RTC product processed by Catalyst, via Microsoft Planetary Computer, CC BY 4.0.CC BY 4.0
- Flood maps used as a check
- Natural Resources Canada, Emergency Geomatics Service; contains information licensed under the Open Government Licence - Canada.Open Government Licence - Canada
- Elevation used in the analysis
- produced using Copernicus WorldDEM-30 © DLR e.V. 2010-2014 and © Airbus Defence and Space GmbH 2014-2018 provided under COPERNICUS by the European Union and ESA; all rights reserved.Copernicus DEM licence
The scan of the old map keeps the collection's own terms. The drawing and text are © 2026 Spatial Nexus, all rights reserved; this does not cover the scan.
Reading
- Finn et al. (2024), Reclaiming the Xhotsa, Frontiers in Conservation Science, https://doi.org/10.3389/fcosc.2024.1380083.
- Lu, McDonald and McIntyre (2026), Geomatics, Natural Hazards and Risk, https://doi.org/10.1080/19475705.2026.2623518.
- Sumas First Nation, Our Territory (the lake's name, Semá:th Xó:tsa), https://sumasfirstnation.com/about/our-territory/ and Our History and Culture (the draining), https://sumasfirstnation.com/about/our-history-and-culture/