Day 11 / Senses: Sound / Eastern United States
The Noise That’s Already Out There, Waiting
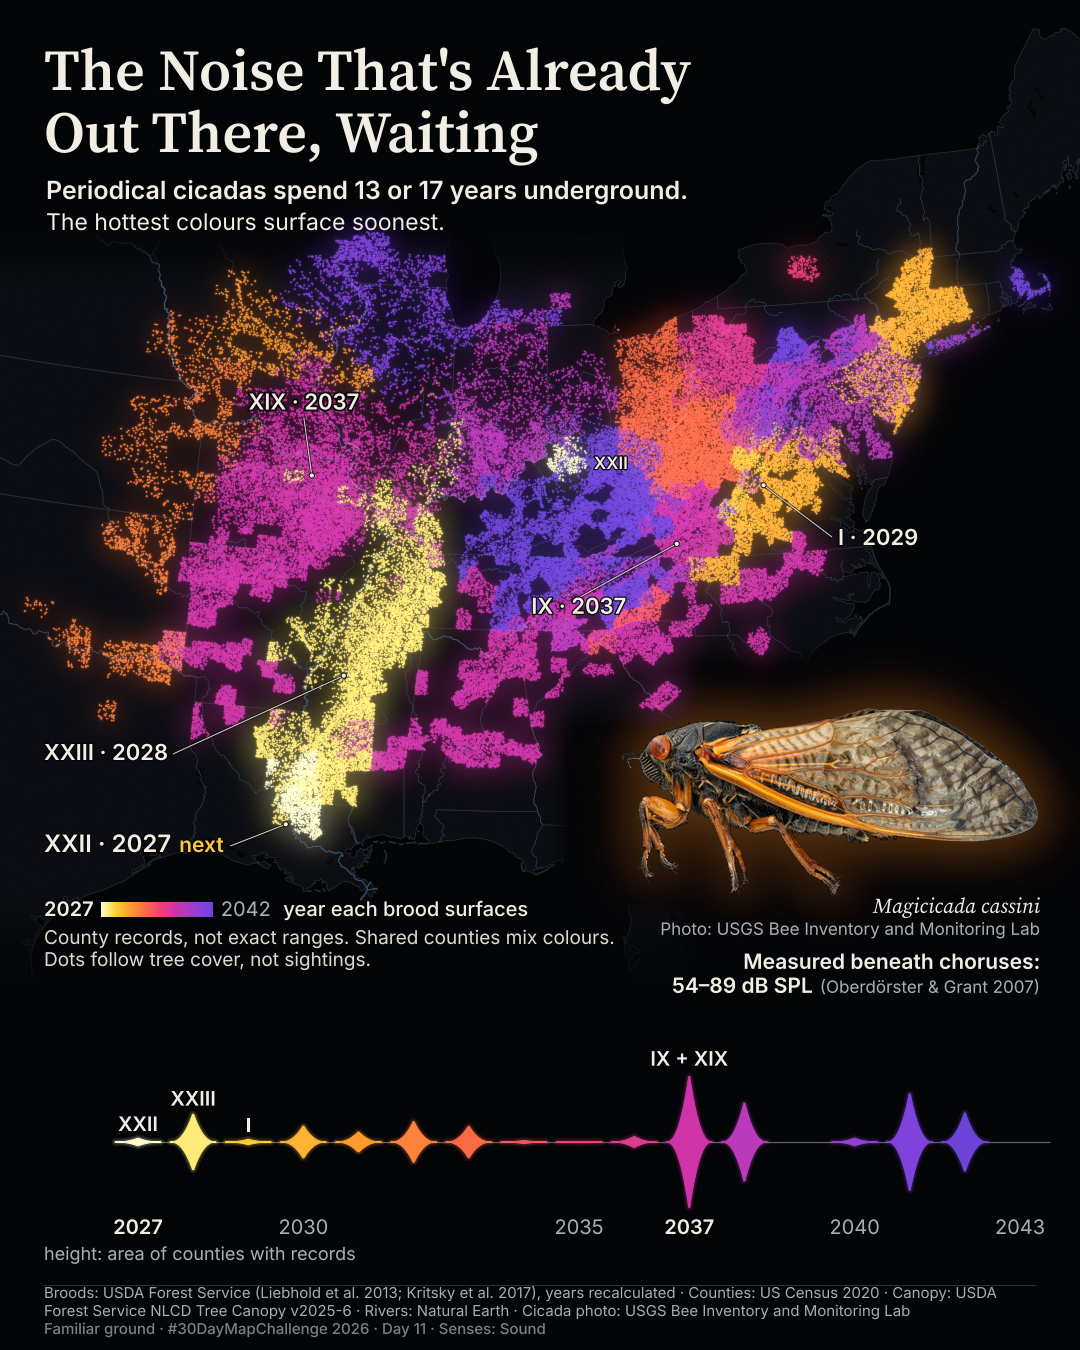
Brood XXII is next, in 2027, around Baton Rouge and southwest Mississippi, with a separate population in Ohio and Kentucky.
Where will the next periodical cicada choruses come from, and when?
Posted on LinkedIn: B ·
 Enlarge
Credits: Broods and canopy: USDA Forest Service · Boundaries: U.S. Census Bureau · Natural Earth · Photo: USGS. Full sources
13 or 17
years underground before a brood emerges
2027
next scheduled emergence · Brood XXII
2037
Broods IX and XIX emerge in the same year
The thinking
What changed and why
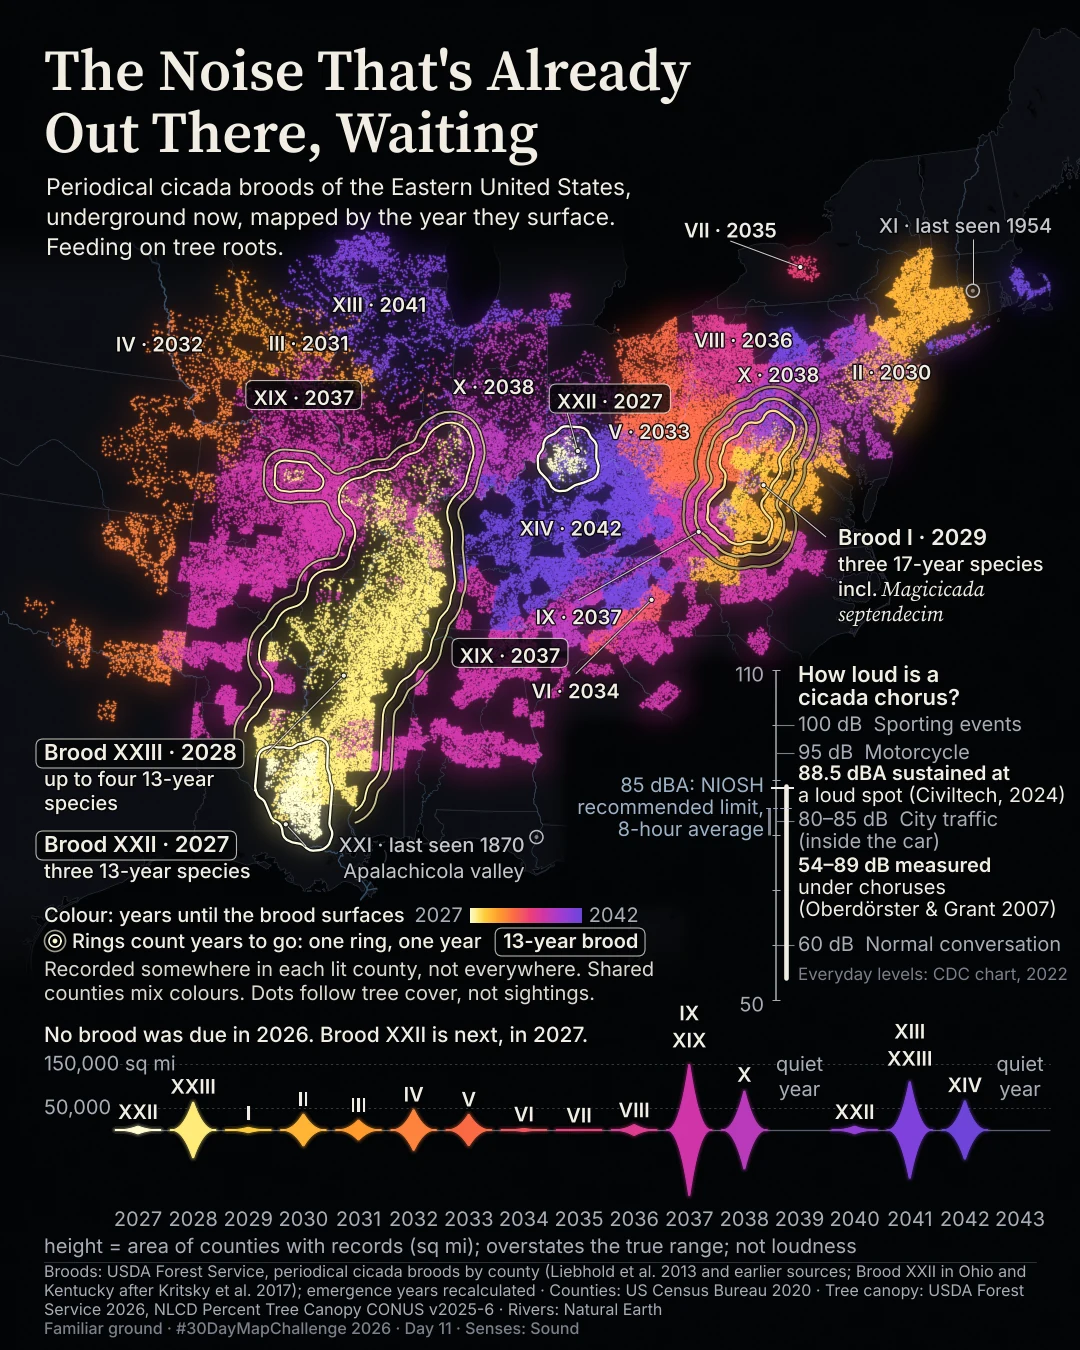
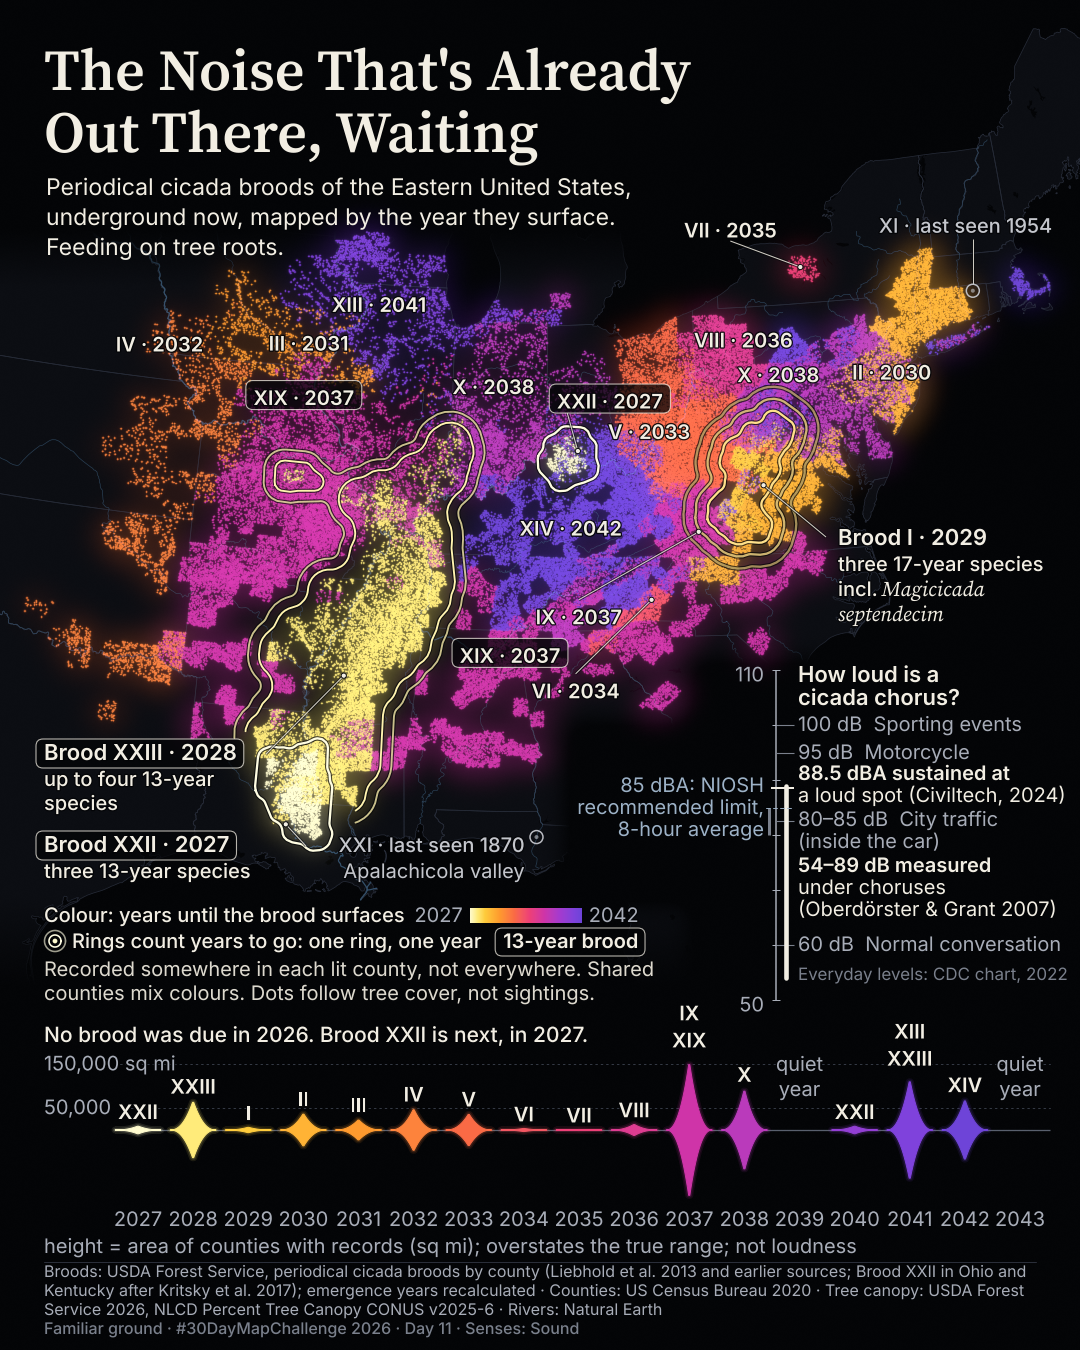
I cut the image from 340 words to 142 and kept five story labels, plus a small tag for the Ohio and Kentucky patch. Rings, extinct-brood marks and the long decibel gauge gave way to a simpler story. The data, years and map layer did not change.
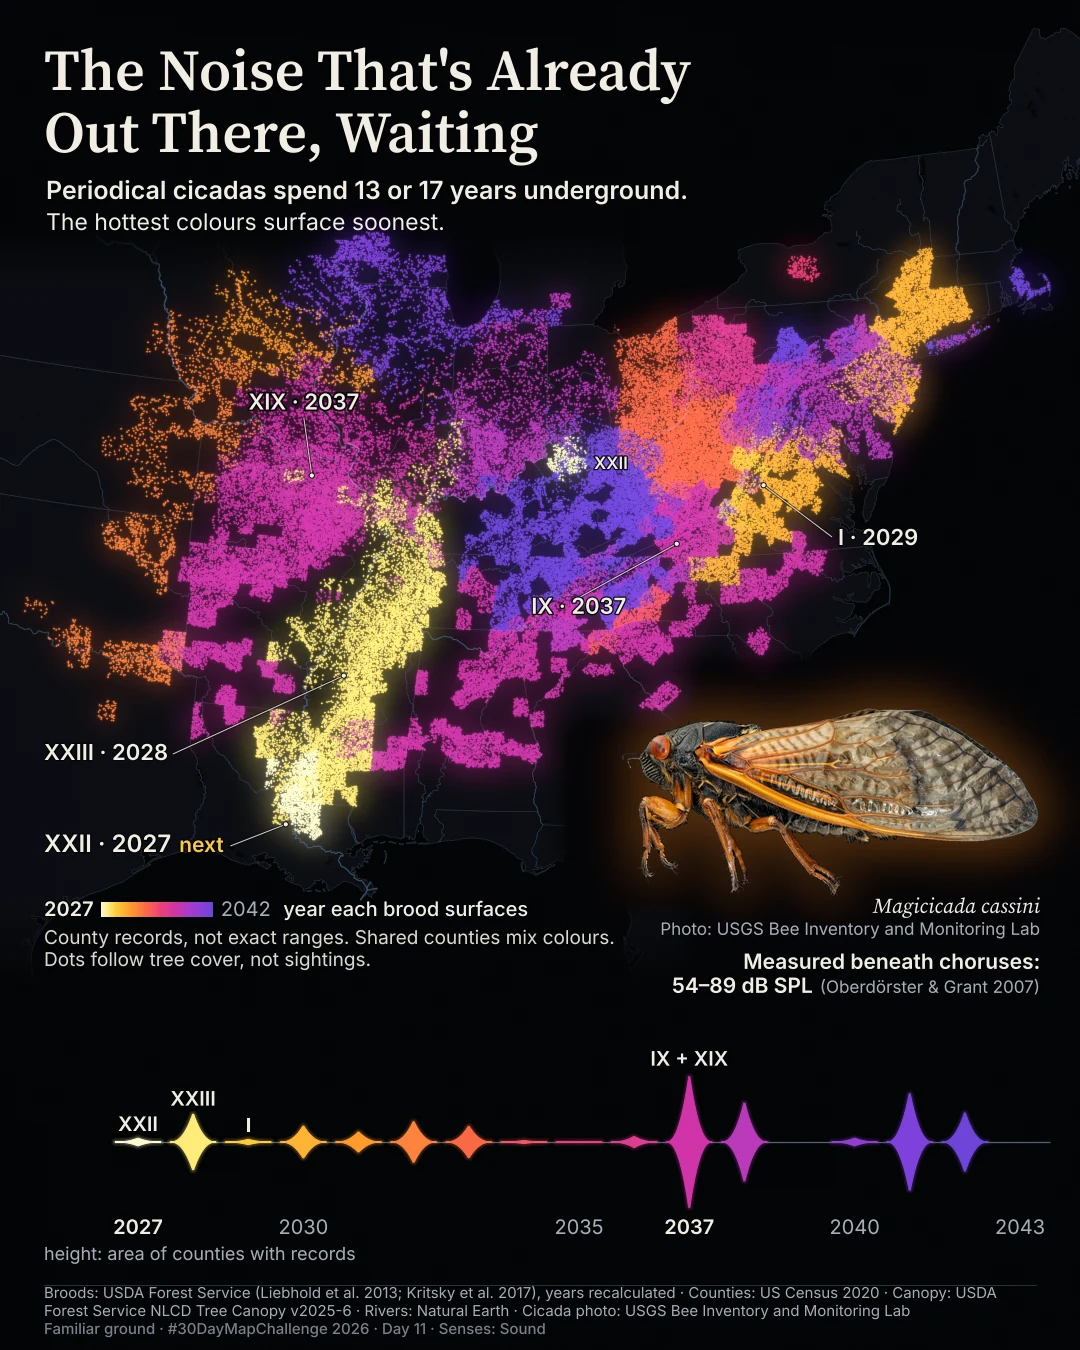
The published revision explains the underground life cycle in the subtitle. A public-domain USGS photograph replaced the intermediate version’s cut-out from a 1930 illustration. I checked the new cut-out at full print zoom, not only at phone size.
Before / after
A second look
Same canvas, different decisions. Drag the divider, or focus the slider and use the arrow keys. This compares layouts, not perfectly registered geography.
Method
How it was made
I joined USDA Forest Service brood records to US Census county boundaries and recalculated emergence years from each brood’s last emergence and cycle. Kritsky and colleagues’ published account adds the Ohio and Kentucky population of Brood XXII. Tree canopy shapes the dot texture, not the brood records. Shared counties mix brood colours evenly. The strip shows the area of counties with records by emergence year, not loudness. The published sound-level line, 54–89 dB SPL, comes from Oberdörster and Grant’s measurements beneath choruses.
Limits
What this cannot tell you
Historic county records overstate the true range and do not prove present occupancy or overlap on the ground. The Ohio and Kentucky patch is especially overstated by county fill. Tree cover is not sightings; denser dots do not mean more or louder cicadas. Emergence years are a schedule, not a promise. Some colours nearly merge under colour-vision simulation. The published subtitle and photo change had render checks and print-zoom inspection, but no independent review.
Next
What I’d do next
I will ask what a stranger needs to know before the map makes sense, inspect every cut-out at full print zoom, and keep everything needed to publish together.
Read my learning logData and credits
Sources
The first and published versions use the same brood records, county join, canopy texture and recalculated years. The revisions change the explanation and illustration, not the analysis.
- Brood records · USDA Forest Service
- Periodical cicada broods: USDA Forest Service (Liebhold, Bohne & Lilja 2013), compiled from Marlatt 1907 and Simon 1988.Public domain / CC0 on the Forest Service item; catalogues also list CC BY 4.0
- Ohio and Kentucky population · Kritsky et al.
- Brood XXII in Ohio and Kentucky after Kritsky et al. 2017, American Entomologist 63(4):E15–E20, doi:10.1093/ae/tmx066. Facts cited; no figure reused.Facts cited
- Boundaries · U.S. Census Bureau
- Boundaries: U.S. Census Bureau, 2020 cartographic boundary files.Free to use with acknowledgement
- Rivers and lakes · Natural Earth
- Made with Natural Earth. Version 5.0.0.Public domain
- Tree canopy · USDA Forest Service
- USDA Forest Service. 2026. USFS NLCD Percent Tree Canopy CONUS v2025-6. Salt Lake City, UT.Use without additional permissions or fees; citation required
- Sound levels · Oberdörster & Grant
- Oberdörster & Grant 2007, Biological Journal of the Linnean Society 90:15–24. Maximum levels beneath dense choruses; meter weighting not stated.Facts cited
- Published cicada photo · USGS
- Cicada photo: USGS Bee Inventory and Monitoring Lab (Anders Croft), Magicicada cassini, 2021.Public domain (US Government work)
- First-version gauge only · Civiltech, CDC and NIOSH
- Civiltech 2024 field reading; CDC chart 2022 everyday levels; NIOSH recommended 85 dBA limit, an 8-hour average. These comparisons were removed from the published revision.Facts cited
My map design and text: Creative Commons Attribution 4.0 (CC BY 4.0). Source data retain the licences above. Every source across the series is on the credits page.