Day 02 / Lines / Dartmoor
The Wheel
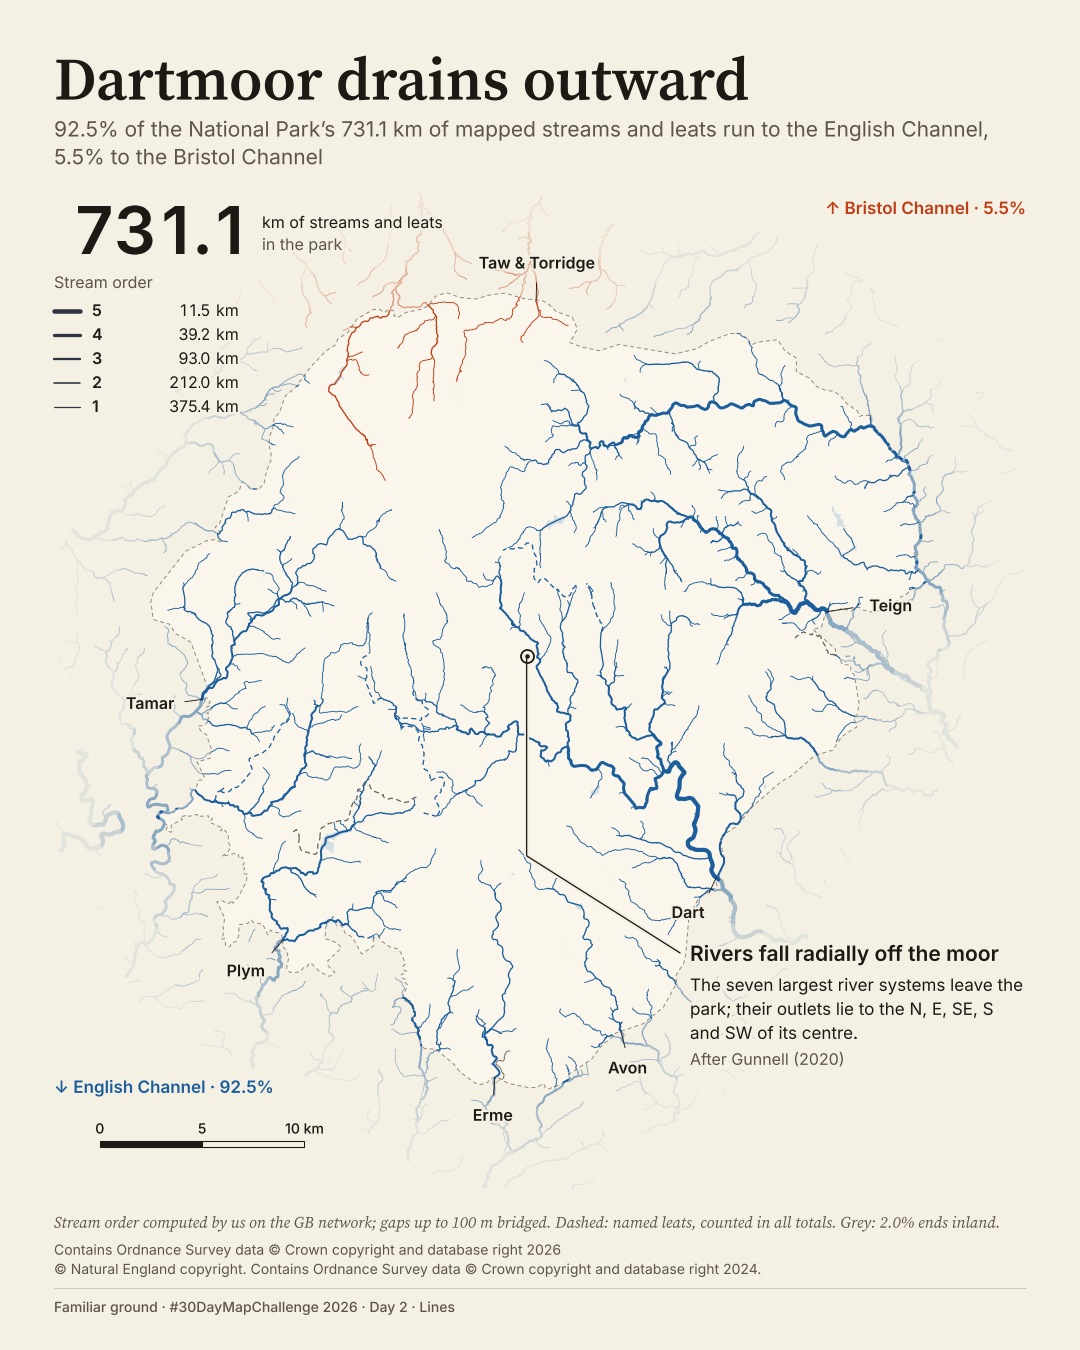
Where do Dartmoor's mapped streams go when they leave the moor?
 Enlarge
Credits: Ordnance Survey, Natural England (OGL v3.0). Full sources
92.5%
of 731.1 km of mapped streams run to the English Channel
5.5%
run to the Bristol Channel
The thinking
What changed and why
I changed seven river colours to one colour per sea. The colours now answer the question instead of identifying seven separate systems.
I replaced the night ground with paper and gave the radial pattern one callout. The seven largest river systems are named at their park exits.
I included named leats in B's total: 731.1 km, of which 92.5% runs to the English Channel and 5.5% to the Bristol Channel. A excludes those leats from its percentages, giving 93.8% and 5.9%; the denominators differ.
I made a film that builds from the main stems towards the headwaters. Its running tally explains stream order before the final sea colours appear.
Before / after
A second look
Same canvas, different decisions. Drag the divider, or focus the slider and use the arrow keys. This compares layouts, not perfectly registered geography.
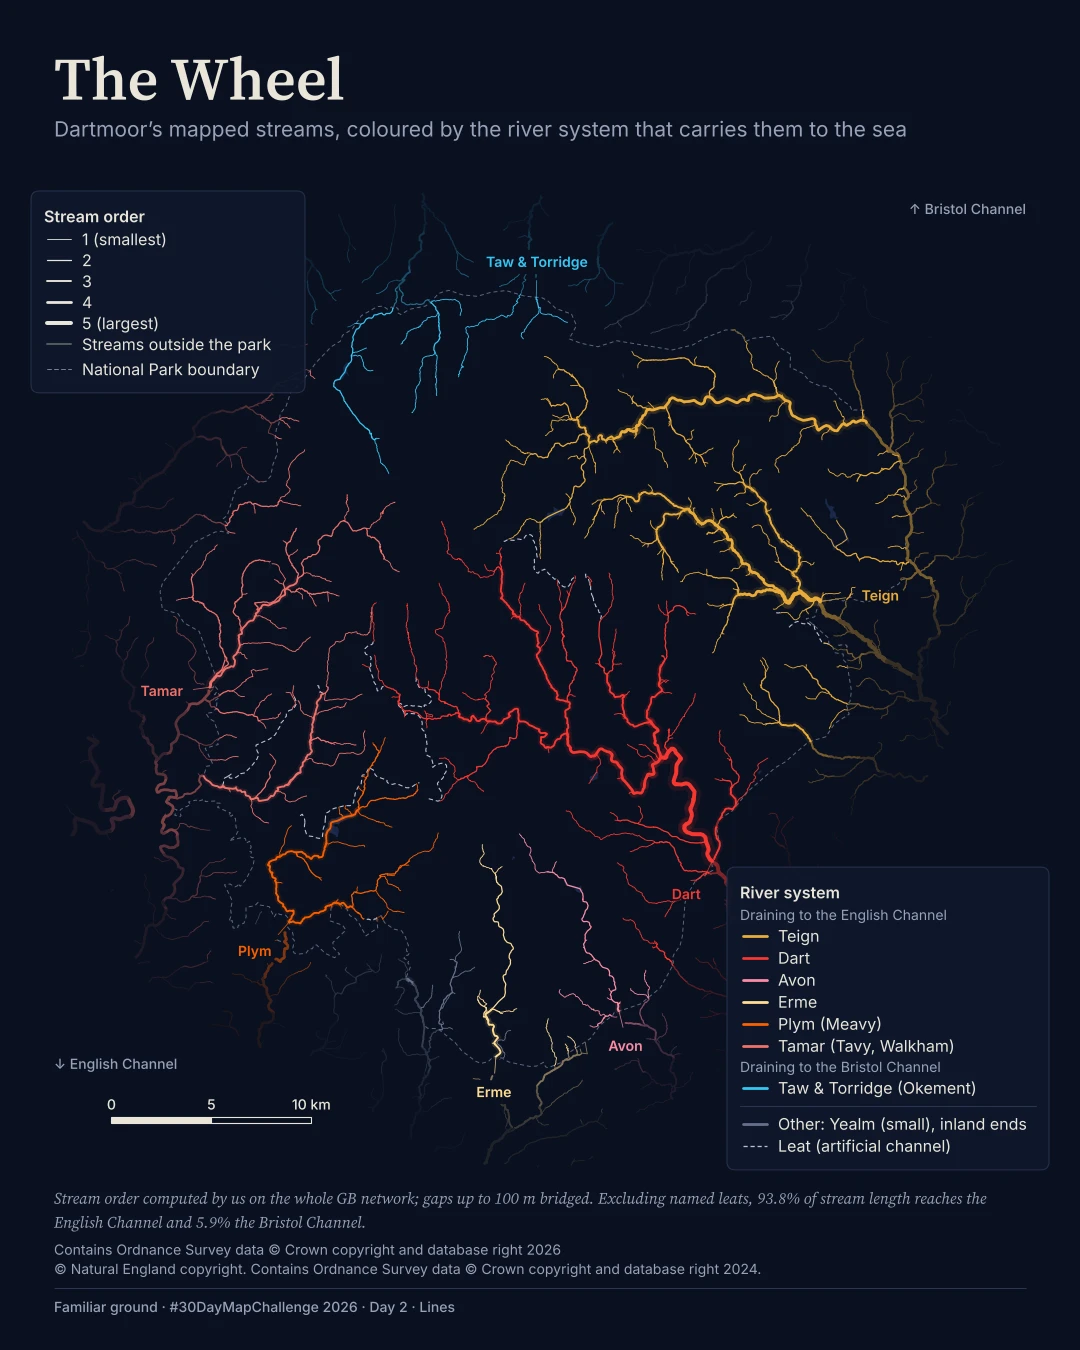
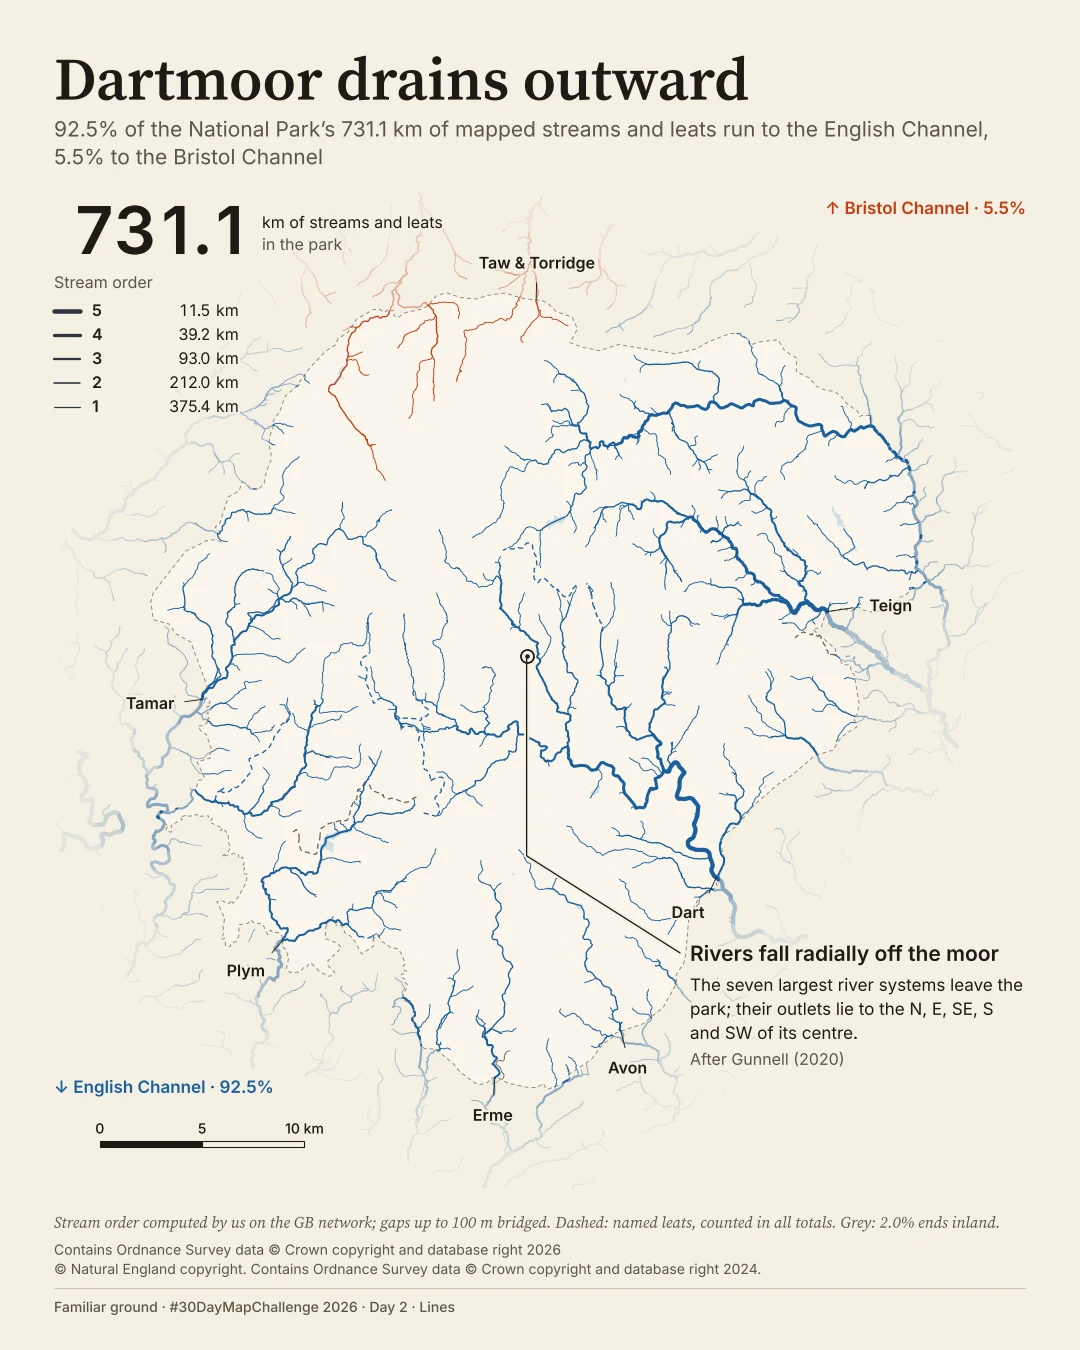
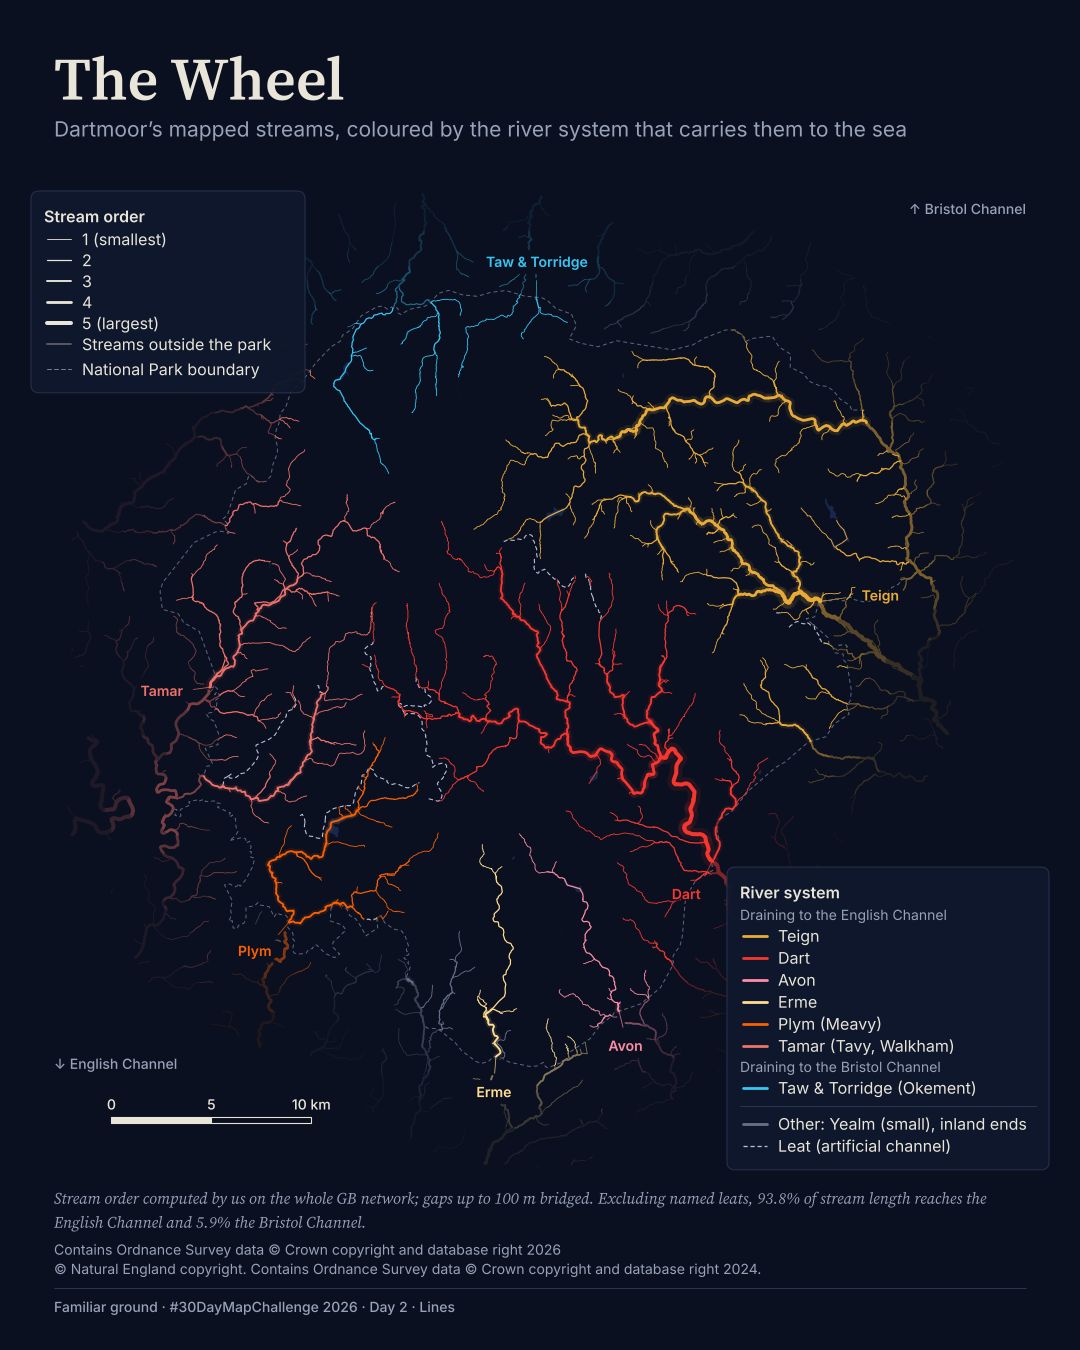
Plate 02 in motion
The film
BThe map in motion
I made a film that builds from the main stems towards the headwaters. Its running tally explains stream order before the final sea colours appear.
Text description of this film
Dartmoor's streams on a light paper ground, with one colour for each receiving sea. 92.5% of 731.1 km of mapped streams run to the English Channel and 5.5% to the Bristol Channel. Dashed lines are named leats. Seven river systems are named where they leave the park; line width indicates stream order.
Method
How it was made
I built a directed river network across Great Britain, bridged gaps of up to 100 m, calculated stream order and receiving systems, then clipped it to Dartmoor. Line width shows how streams join together, not measured flow. I filtered, clipped and re-symbolised the source data.
Limits
What this cannot tell you
This is mapped stream length, not water volume or a flood model. The two sea percentages do not sum to 100%; they are the shares assigned to those seas in this mapped network, not a complete water balance.
Next
What I’d do next
I would make the denominator explicit from the start, check the final colour-vision simulations by eye and get a second independent look at the revised render. A strong network score does not prove that every bridged connection is right.
Read my learning logData and credits
Sources
I clipped, filtered and re-symbolised the data. Stream order and river systems were computed on the whole GB network, with gaps up to 100 m bridged.
- OS Open Rivers and OS VectorMap District water · A and B
- Contains Ordnance Survey data © Crown copyright and database right 2026Open Government Licence v3.0
- National Park boundary · A and B
- © Natural England copyright. Contains Ordnance Survey data © Crown copyright and database right 2024.Open Government Licence v3.0
My map design and text: Creative Commons Attribution 4.0 (CC BY 4.0). Source data retain the licences above. Every source across the series is on the credits page.