Day 04 / Clusters / Edinburgh
Where the stone gathers
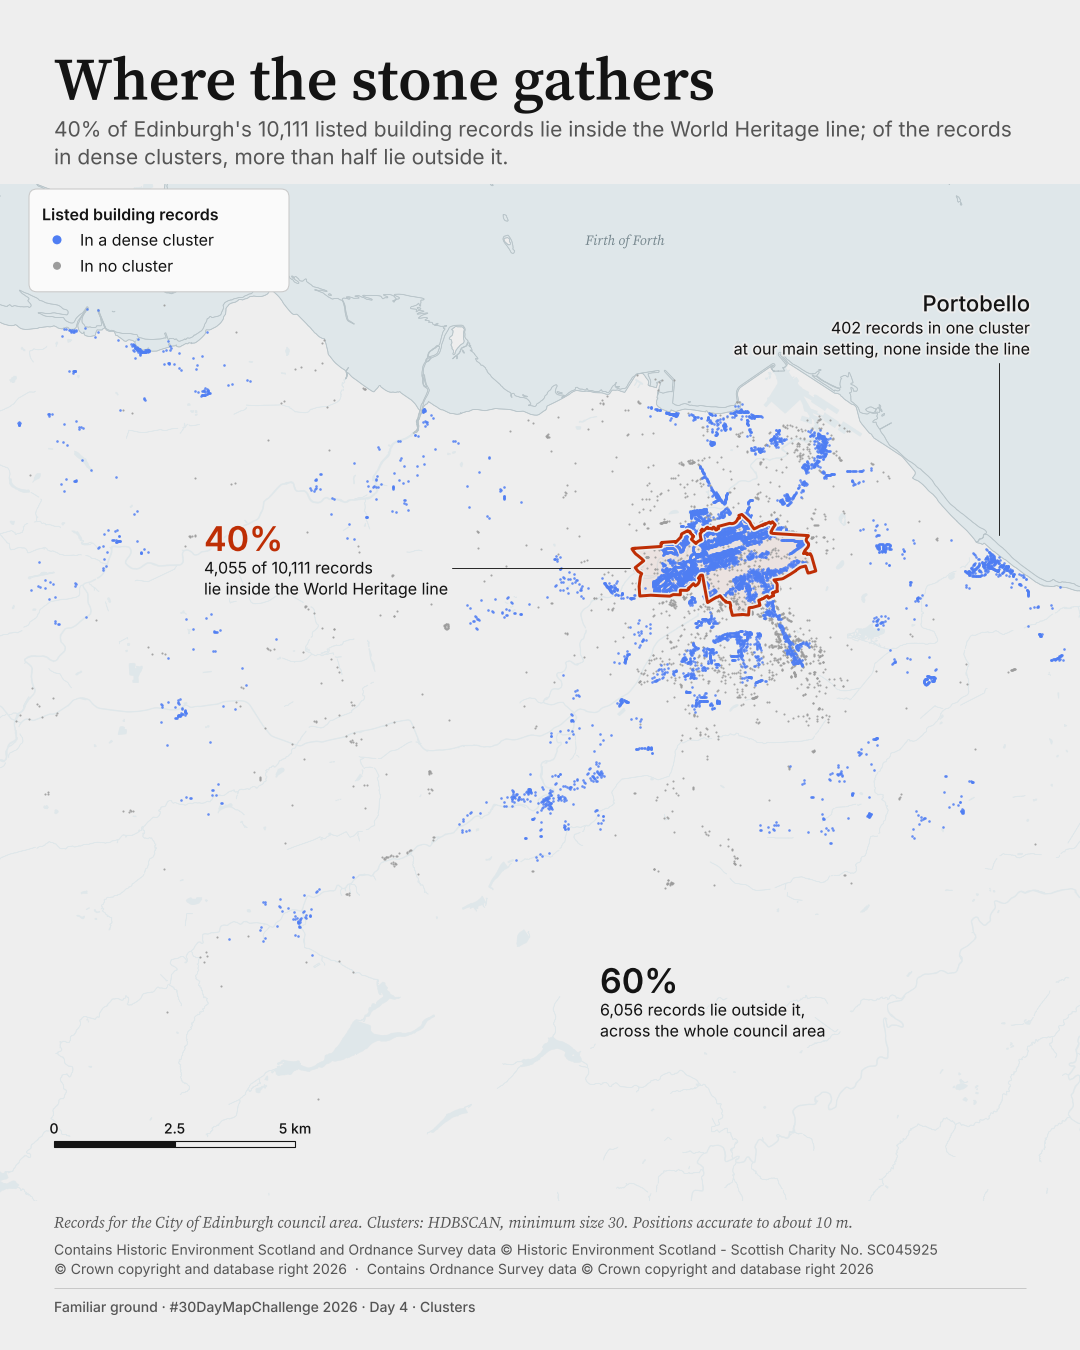
How much of Edinburgh's listed-building pattern lies beyond the World Heritage boundary?
Posted on LinkedIn: B3 ·
 Enlarge
Credits: Historic Environment Scotland, Ordnance Survey. Full sources
40%
of 10,111 listed-building records lie inside the World Heritage line
60%
lie outside it, across the whole council area
The thinking
What changed and why
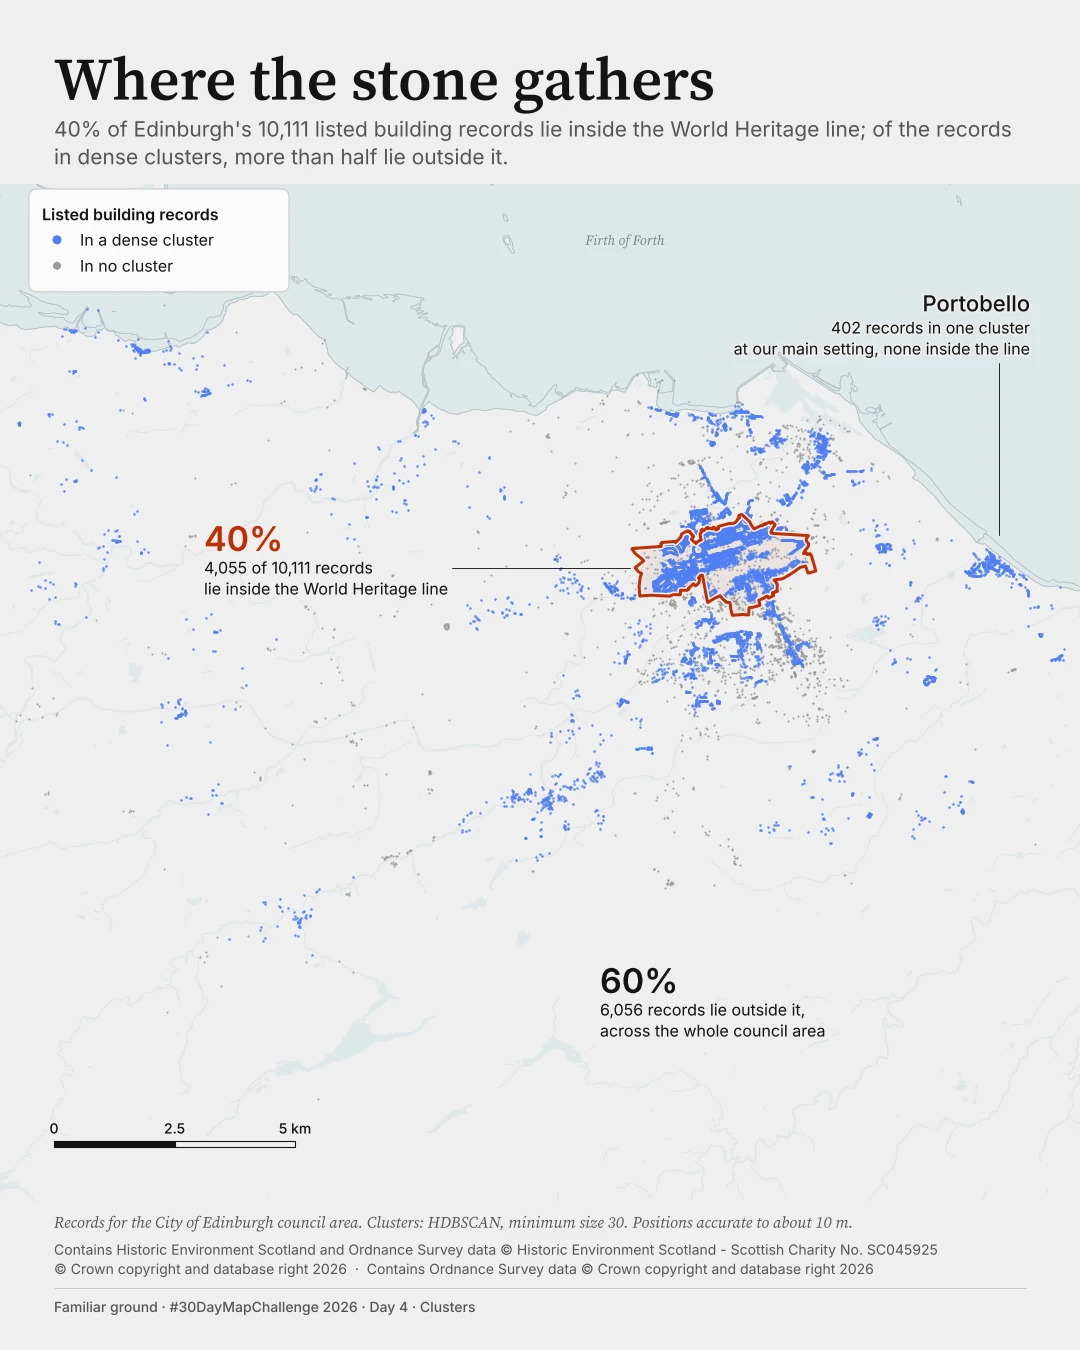
I replaced eight reused cluster colours with slate blue for clustered records and pale dots for the rest. The World Heritage line is now the only warm colour.
I made the stable finding the subtitle: 40% of 10,111 listed-building records lie inside the line. More than half of clustered records lie outside across all nine tested HDBSCAN settings and three DBSCAN settings.
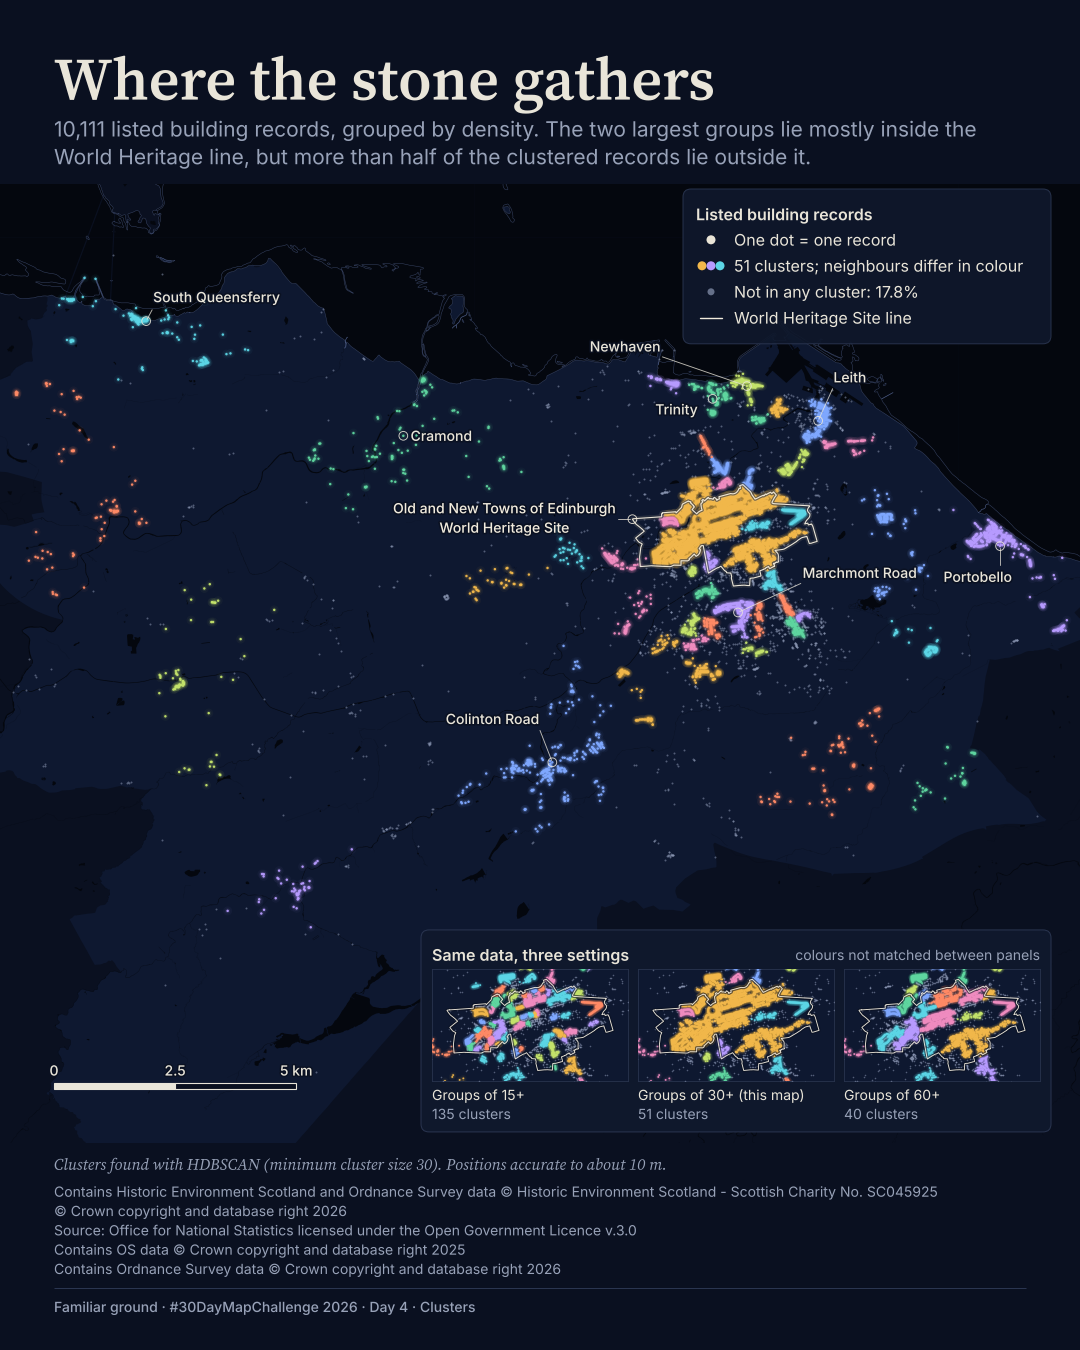
I removed the sensitivity inset from B and kept three callouts. I do not claim that clustering redraws the World Heritage boundary: that test passed at only three of nine settings.
I changed B2's grey sea because it read as a large dark block. In B3 I used a very pale blue-grey sea (#DFE7EA), a thin coastline and a Firth of Forth label. It reads as water at phone size without taking attention from the blue dots, which stay the strongest colour.
Before / after
A second look
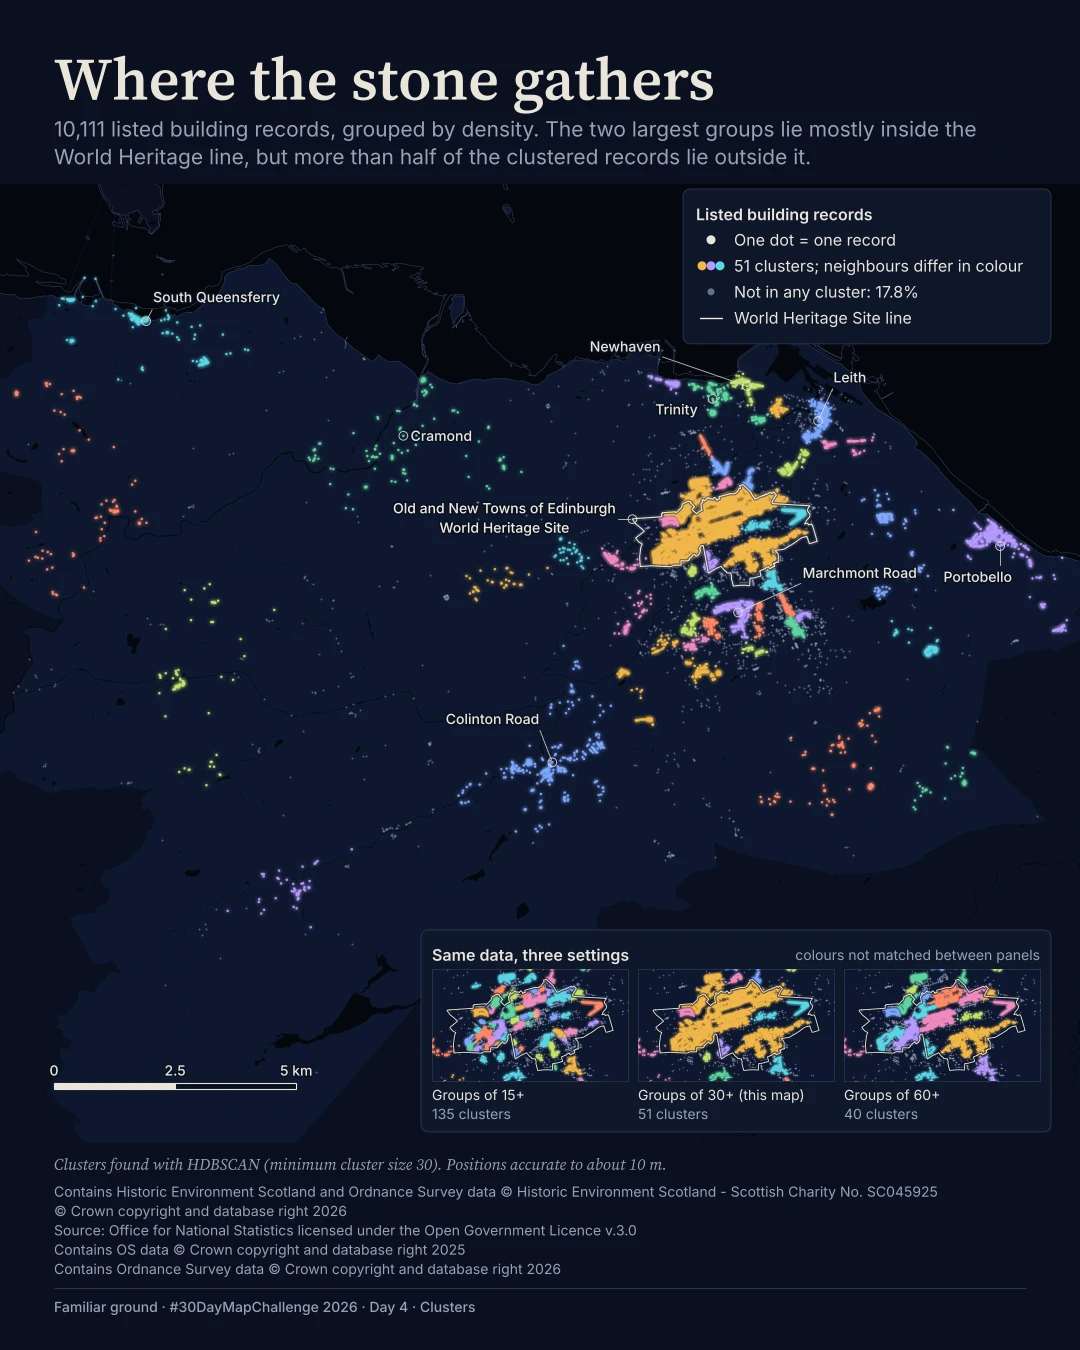
Same canvas, different decisions. Drag the divider, or focus the slider and use the arrow keys. This compares layouts, not perfectly registered geography.
Method
How it was made
I grouped listed-building records by spatial density, compared their positions with the World Heritage polygon and checked alternative clustering settings. B reuses A's clustering rather than fitting a new result. The inside/outside split does not depend on those settings.
Limits
What this cannot tell you
The unit is a listed-building record, not necessarily a separate building or location, and a count is not a measure of heritage value. Only City of Edinburgh council records are shown. Clusters at the coast and council edge can be cut short. The Portobello count belongs to the main setting, not every setting.
Next
What I’d do next
I would verify HES category definitions before attempting a Category A view, compare the boundary vintage with UNESCO's 2024 clarification map, and match cluster colours across sensitivity panels if I bring the inset back.
Read my learning logData and credits
Sources
I filtered, clustered and re-symbolised the data. The council boundary was used upstream but is not drawn in B.
- Listed-building records and World Heritage boundary
- Contains Historic Environment Scotland and Ordnance Survey data © Historic Environment Scotland - Scottish Charity No. SC045925 © Crown copyright and database right 2026Open Government Licence v3.0
- Water
- Contains Ordnance Survey data © Crown copyright and database right 2026Open Government Licence v3.0
- Council boundary · preparation, not drawn in B
- Source: Office for National Statistics licensed under the Open Government Licence v.3.0 Contains OS data © Crown copyright and database right 2025Open Government Licence v3.0
The source method flags HES and OS attribution years as inferred from the manifests, not confirmed with the publishers. I have preserved those strings exactly; confirmation is still needed before publication.
My map design and text: Creative Commons Attribution 4.0 (CC BY 4.0). Source data retain the licences above. Every source across the series is on the credits page.