Day 05 / Sight / London
St Paul's dome viewshed
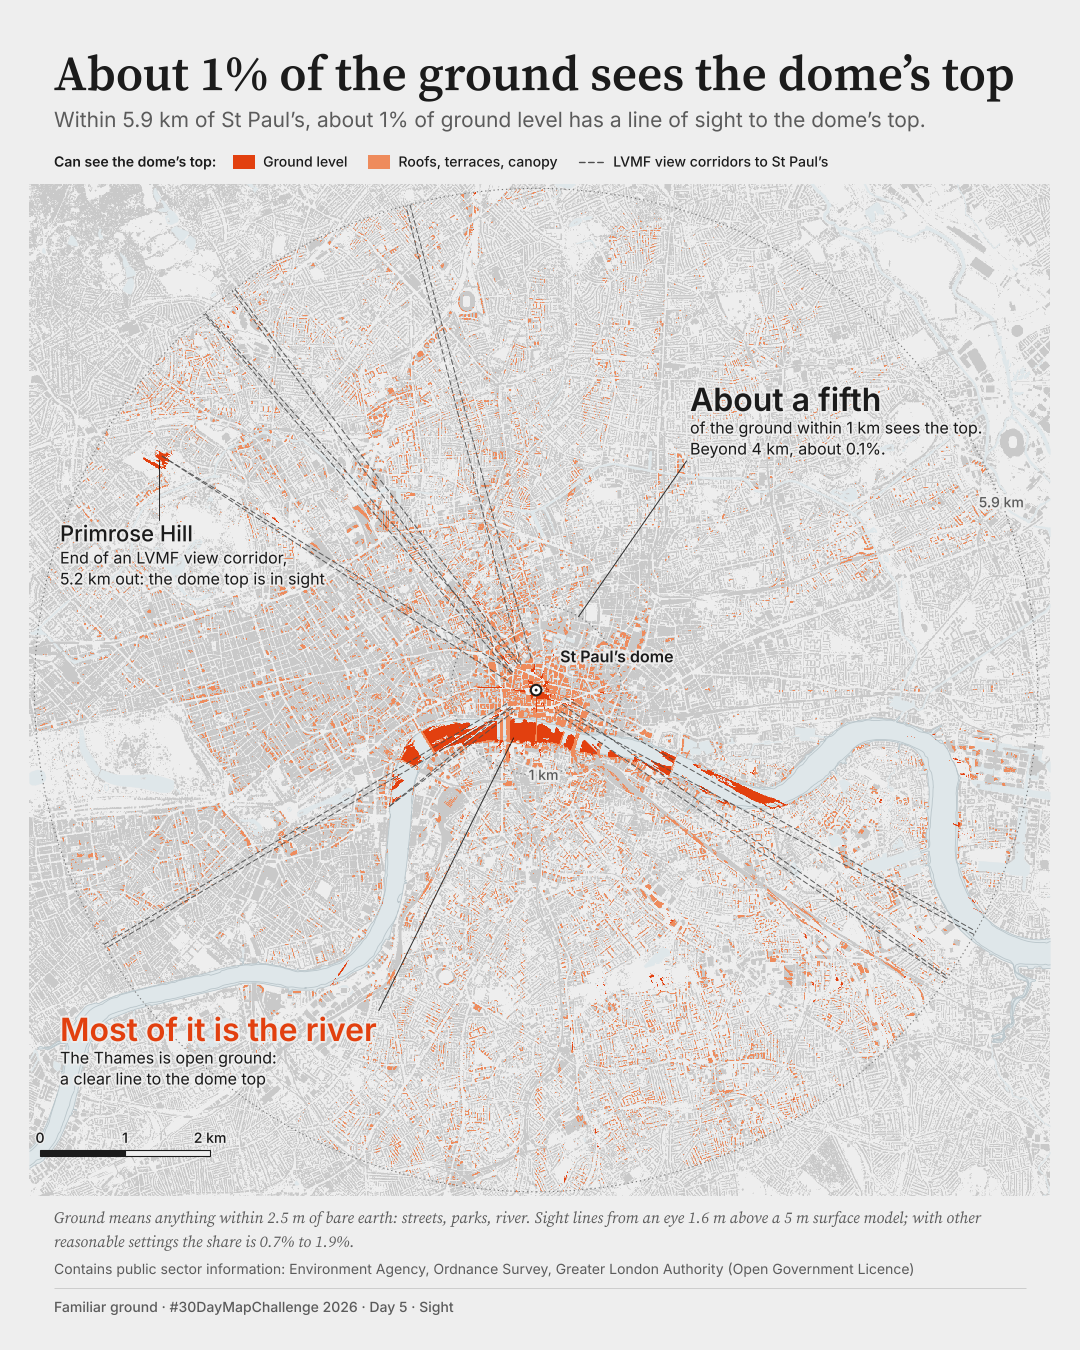
About 1% of the ground sees the dome's top.
How much of London can see the top of the dome of St Paul's?
 Enlarge
Credits: Environment Agency, Ordnance Survey, Greater London Authority (Open Government Licence). Full sources
About 1%
of ground level within 5.9 km has a line of sight to the top of the dome; 0.7% to 1.9% across my tests
About a fifth
of the ground within 1 km sees the top
About 0.1%
of the ground beyond 4 km
The thinking
What I tried and why
A dark ground would have meant nothing here: the question is about sight, not night. So the ground is grey and vermilion is the only strong colour. With nothing else competing, the river reads at once as the one big shape, and that is the finding.
I planned a callout for a long view along a street. The data refused it: the longest land patch that sees the top is 385 m. I used the fall-off with distance instead, which the data do show.
My first draft thickened every visible cell and made the speckle of streets look like the main story. Drawing coverage per pixel instead left the river as the story, which is what the numbers say.
Method
How it was made
I took the Environment Agency's 5 m height data for the surface as surveyed, put an observer 1.6 m above it and drew a line of sight to the top of the dome from every cell within 5.9 km. The target is my own measurement from the data, 1 m below the highest surface in the 1 m LIDAR near the dome (119.0 m above Ordnance Datum), not an official height. Ground means anything within 2.5 m of bare earth, so streets, parks, squares and water. Rays are sampled every 2.5 m, with a correction for curvature and refraction.
Limits
What this cannot tell you
This is geometry only: no haze, no contrast, and trees count as obstacles. My obstacle surface leans cautious; with a smoother surface the figure is nearer 2%. The range across my tests is 0.7% to 1.9%, so the size of the number is fragile even though the pattern is not. Ground includes the river. Nobody has stood in these places to check.
Next
What I’d do next
I would take the map outside: check a handful of the predicted views on the ground, and see how it reads on a real phone in daylight rather than a desktop render.
Read my learning logData and credits
Sources
Data were filtered, analysed and re-symbolised by me. Corridors are the July 2010 digitisation, drawn as dashed outlines.
- Surface heights · Environment Agency LIDAR composite
- © Environment Agency copyright and/or database right 2022. All rights reserved.Open Government Licence (version unstated in the provider record; v3 assumed, to confirm)
- Water · Ordnance Survey open map data
- Contains Ordnance Survey data © Crown copyright and database right 2026Open Government Licence v3.0
- View corridors · London View Management Framework
- Contains public sector information licensed under the Open Government Licence v2.0. Source: Greater London Authority (LVMF protected vistas, SPG July 2010)Open Government Licence v2.0
My map design and text: Creative Commons Attribution 4.0 (CC BY 4.0). Source data retain the licences above. Every source across the series is on the credits page.