Day 07 / 10 minute map / Glasgow
About one in nine Glaswegians lives within a 10-minute walk of the Subway
The loop has 15 stations, but covers only a small part of the city.
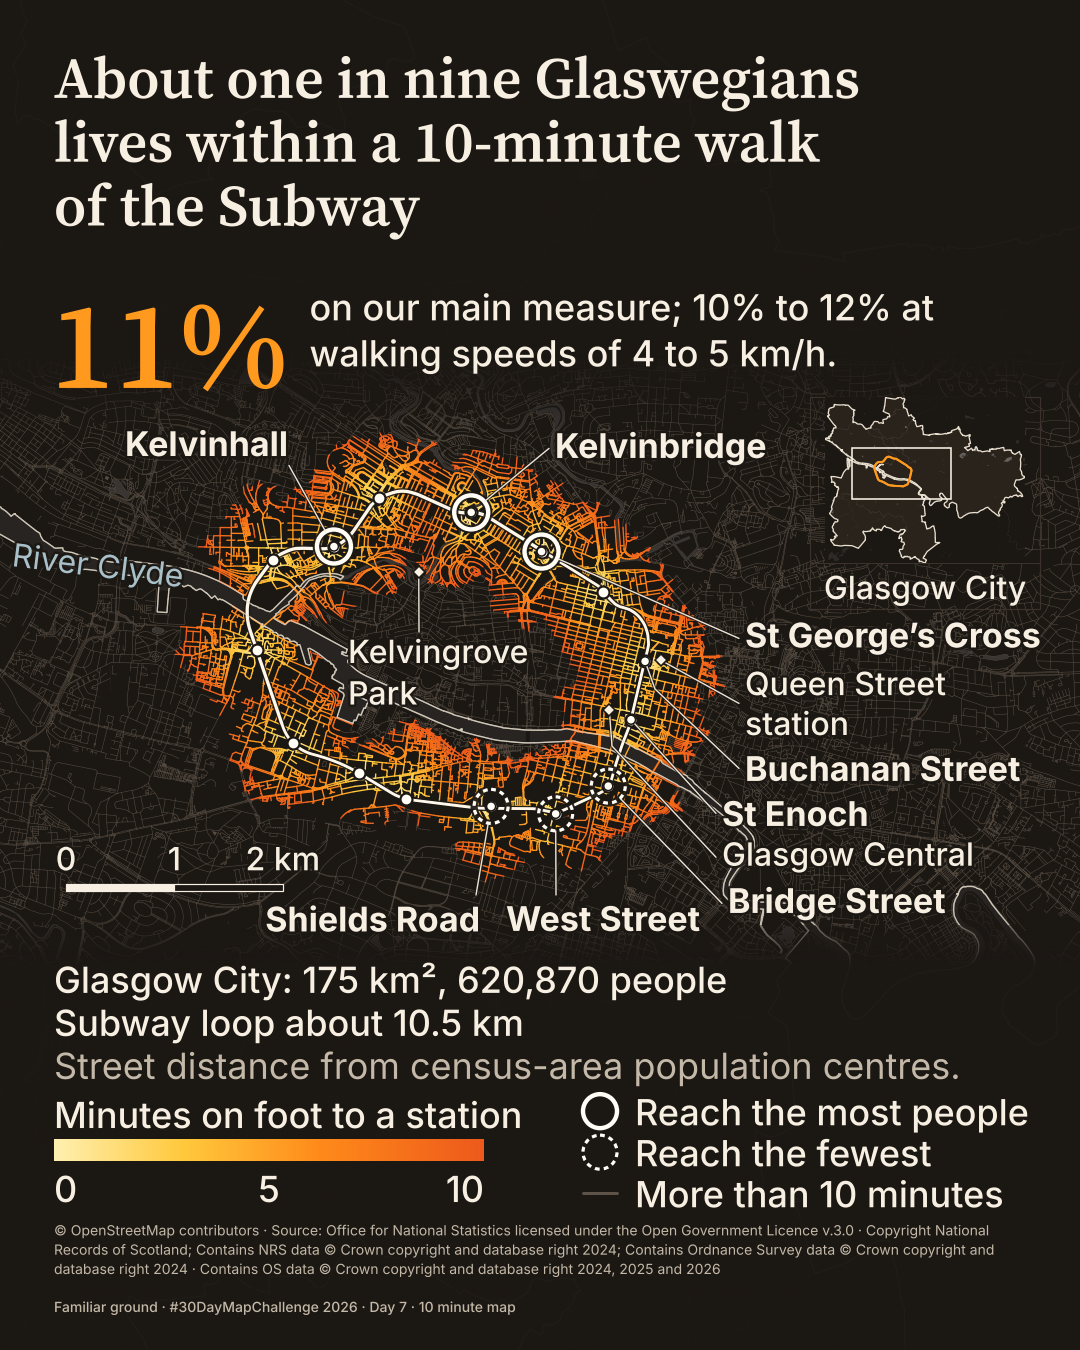
How many Glaswegians live within a 10-minute walk of the Subway?
 Enlarge
Credits: OpenStreetMap contributors; National Records of Scotland, ONS, Ordnance Survey. Full sources
11%
of residents, about one in nine, are within a modelled 10-minute walk of a Subway station; 10% to 12% at 4 to 5 km/h
8.1%
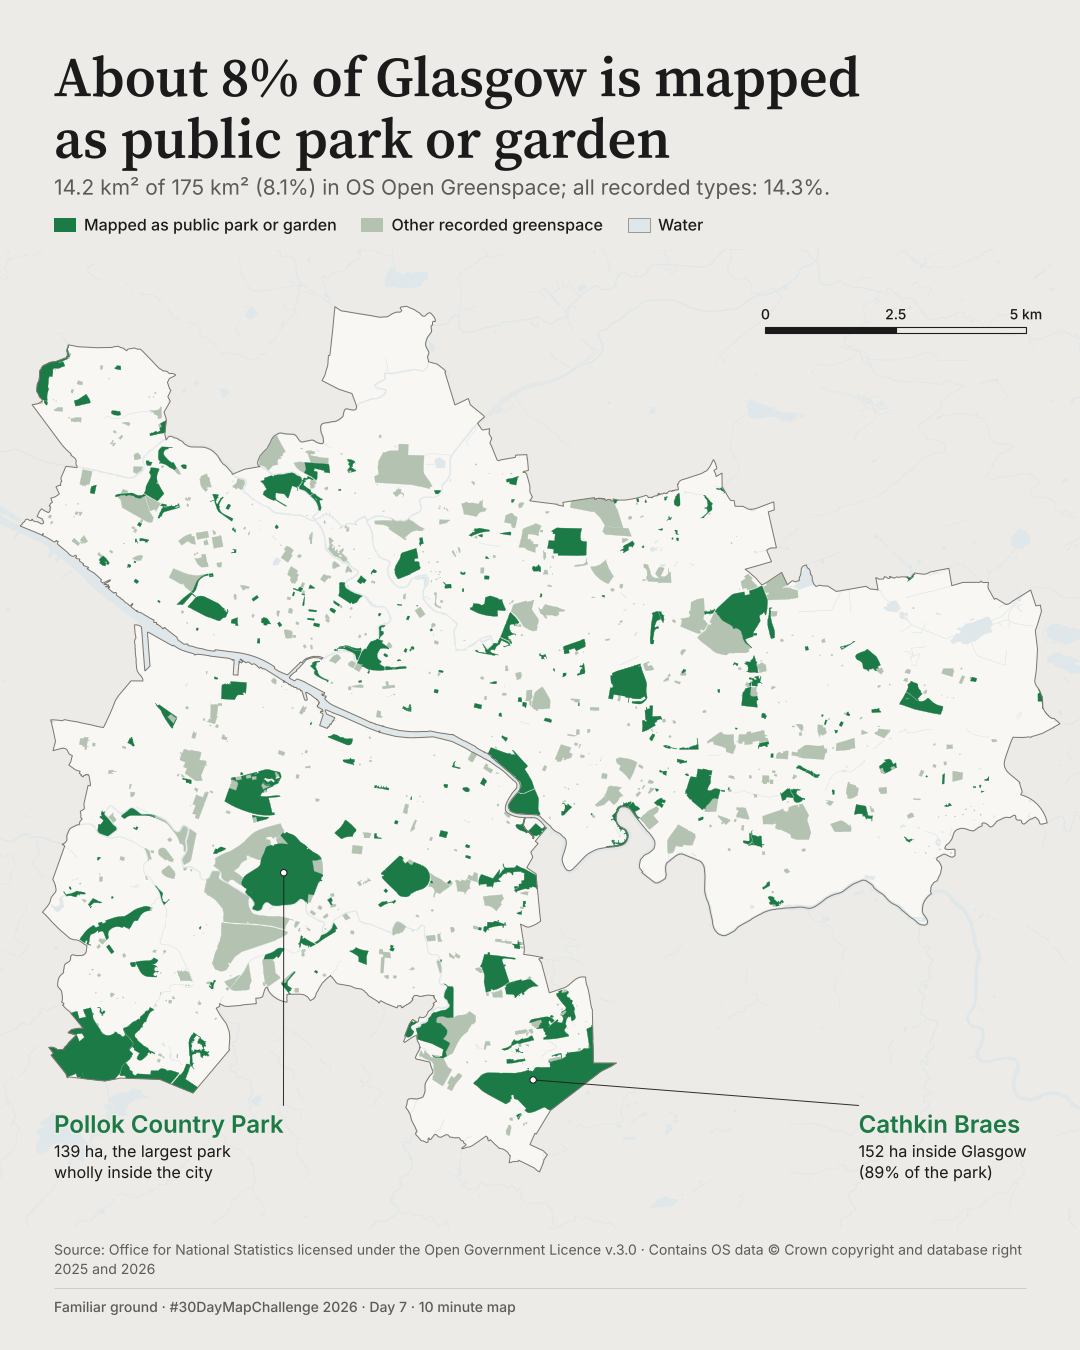
of Glasgow City, 14.2 km² of 175 km², is mapped as Public Park Or Garden
63 seconds
from first command to first render of map A, with data and style prepared beforehand
The thinking
What changed and why
The prompt was 10 minutes, so I timed the drawing. Map A took 63 seconds from first command to first render, plus under a minute fixing three small faults. The data and analysis were prepared beforehand, with the drawing style ready to reuse.
Map A looked too much like the day before it, so I made a second map that clearly differs: transport instead of green space, lines instead of polygons, a dark ground for the underground and one warm colour.
An earlier version of map B gave little sense of Glasgow itself. I cut the text by about a third and added the stations people know, an inset of the whole city and the size of the place. Map A is kept here beside it.
Method
How it was made
Map A measures the area OS Open Greenspace records as Public Park Or Garden inside the Glasgow City council boundary: 14.2 km² of 175 km². All recorded greenspace types together cover 14.3%. Map B models walking along the OpenStreetMap street network from census-area population centres to the 15 Subway stations, 800 m at 4.8 km/h. On that measure 71,172 of 620,870 residents are within reach, 11%; the range across walking speeds of 4 to 5 km/h is 10% to 12%.
Limits
What this cannot tell you
OS describes these green spaces as likely to be accessible to the public. 'Mapped as' matters: this is what OS has recorded, not a measure of access or of all green land. Map B is modelled walking from census-area population centres, not actual journeys. Hills, crossings and time to the platform are not included, and catchments overlap, so station counts do not add up.
Next
What I’d do next
I would check whether OS's Public Park Or Garden matches what residents would call a park, and test the Subway map on a real phone in daylight.
Read my learning logData and credits
Sources
Data were filtered, dissolved, joined and re-symbolised by me.
- Parks and water · map A; water · map B
- Contains Ordnance Survey data © Crown copyright and database right 2026.Open Government Licence v3.0
- Glasgow City boundary · both maps
- Source: Office for National Statistics licensed under the Open Government Licence v.3.0 Contains OS data © Crown copyright and database right 2025.Open Government Licence v3.0
- Walking network, Subway route, stations and named places · map B
- © OpenStreetMap contributorsOpen Database Licence
- Population · Scotland's Census 2022 output areas · map B
- Copyright National Records of Scotland; Contains NRS data © Crown copyright and database right 2024; Contains Ordnance Survey data © Crown copyright and database right 2024Open Government Licence v3.0
The 2024 year in the National Records of Scotland credit is inferred from the data product and still needs confirming.
My map design and text: Creative Commons Attribution 4.0 (CC BY 4.0). Source data retain the licences above. Every source across the series is on the credits page.