Day 08 / Utopia / Manchester
About half of Manchester lives within 300 m of a mapped park
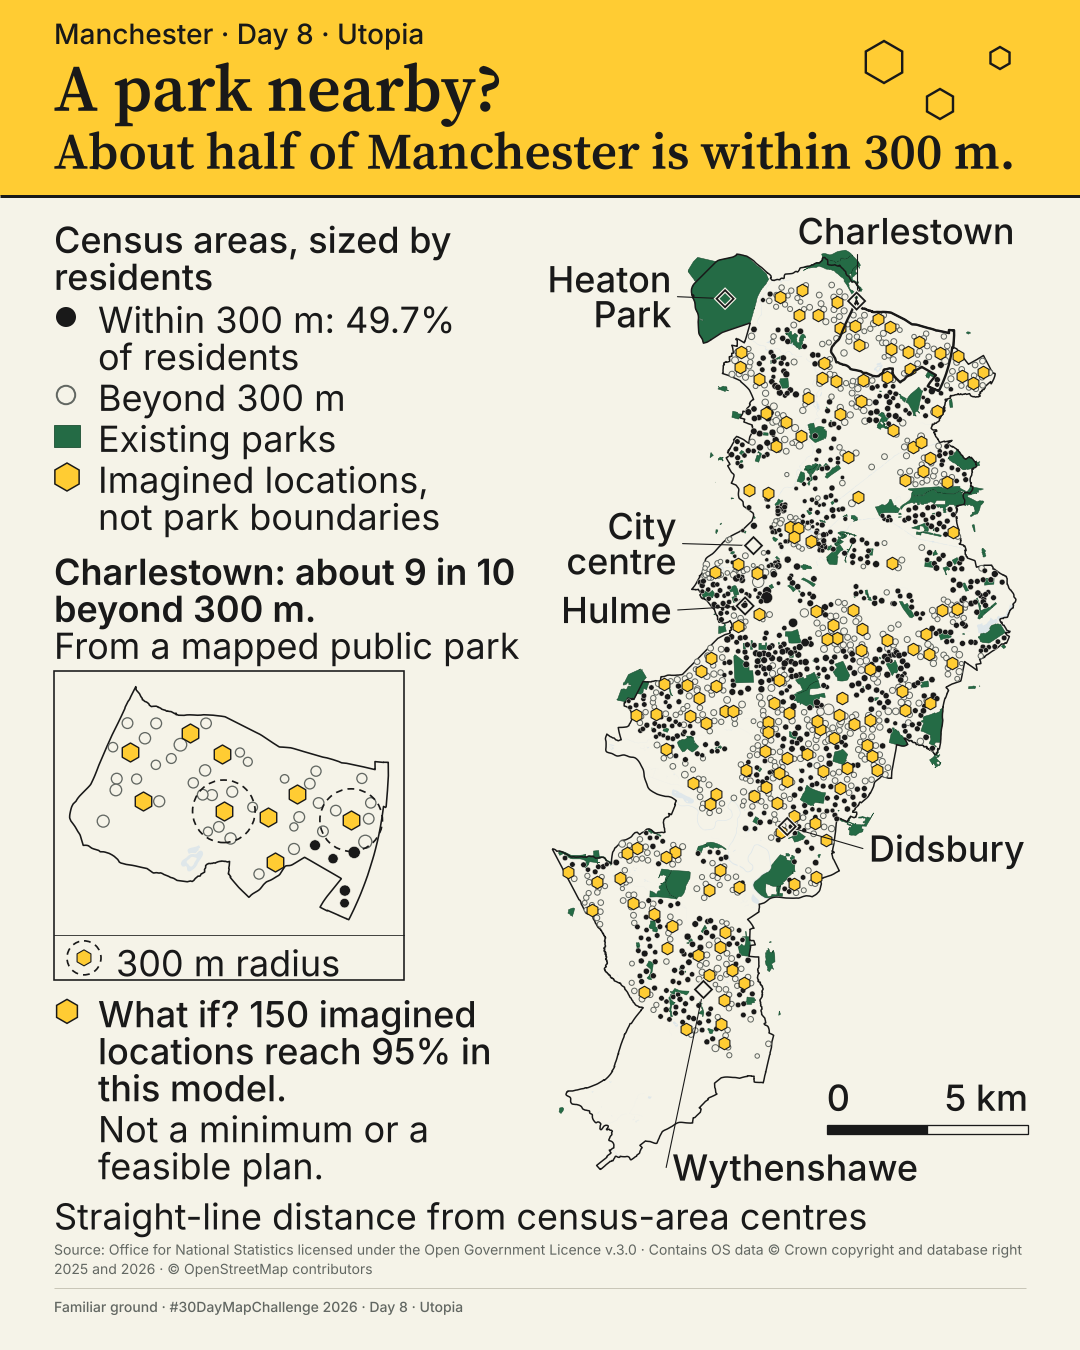
In this analysis 49.7% of Manchester lives within 300 m of a mapped public park.
How close is Manchester to a city where every resident lives within 300 m of a mapped park?
 Enlarge
Credits: Ordnance Survey, ONS (OGL v3.0); OpenStreetMap contributors; Konijnendijk (2023). Full sources
49.7%
of residents, 274,370 of 551,924, live within 300 m of a mapped public park on the primary measure
9 in 10
residents in Charlestown are more than 300 m from a mapped public park
150
imagined locations reach 95% in this model; neither a minimum nor a feasible plan
The thinking
What I tried and why
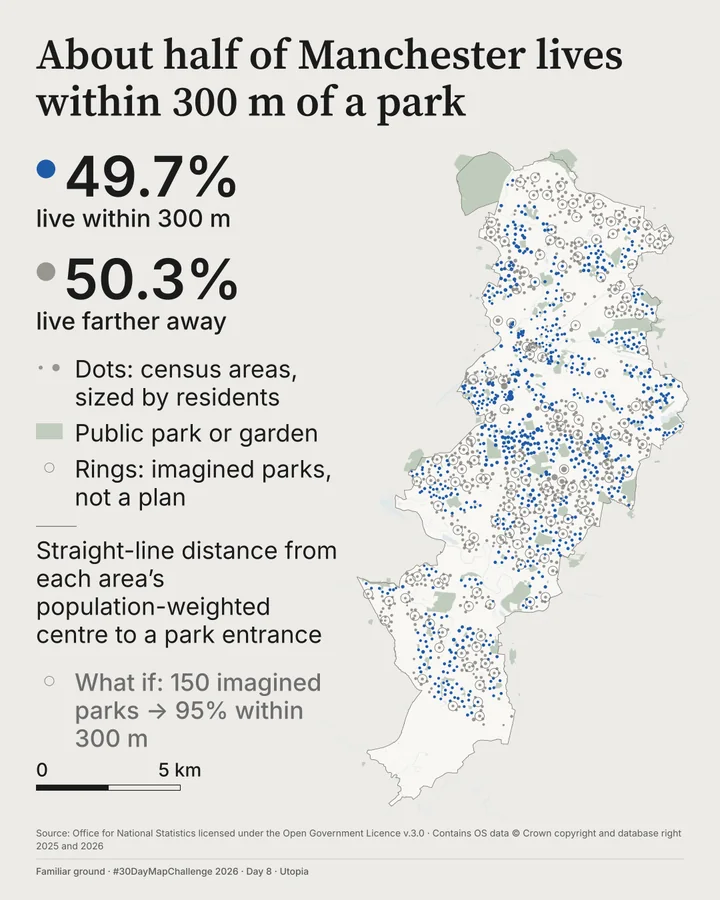
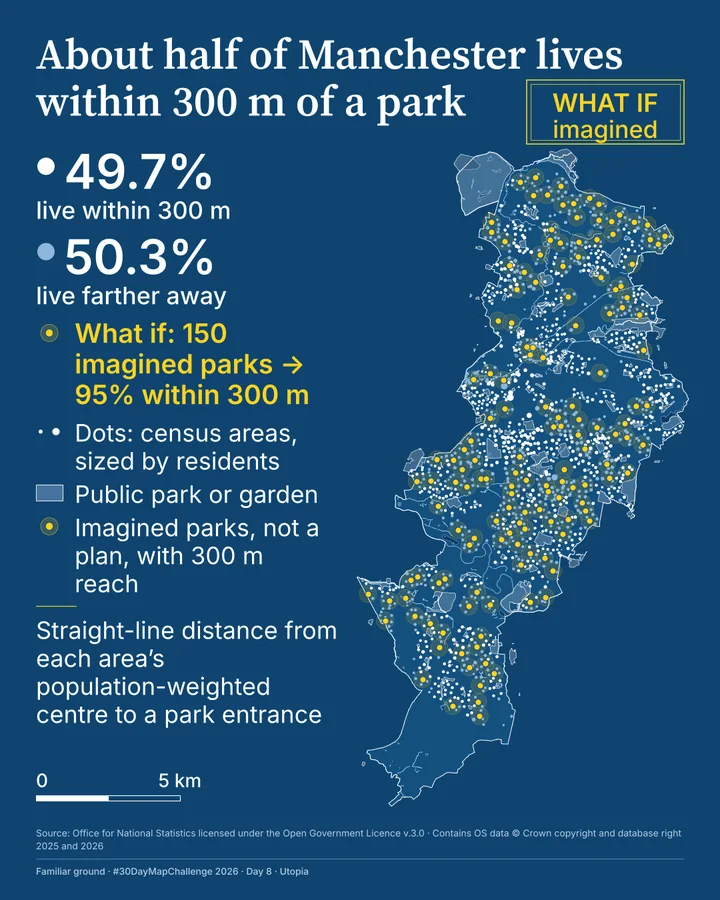
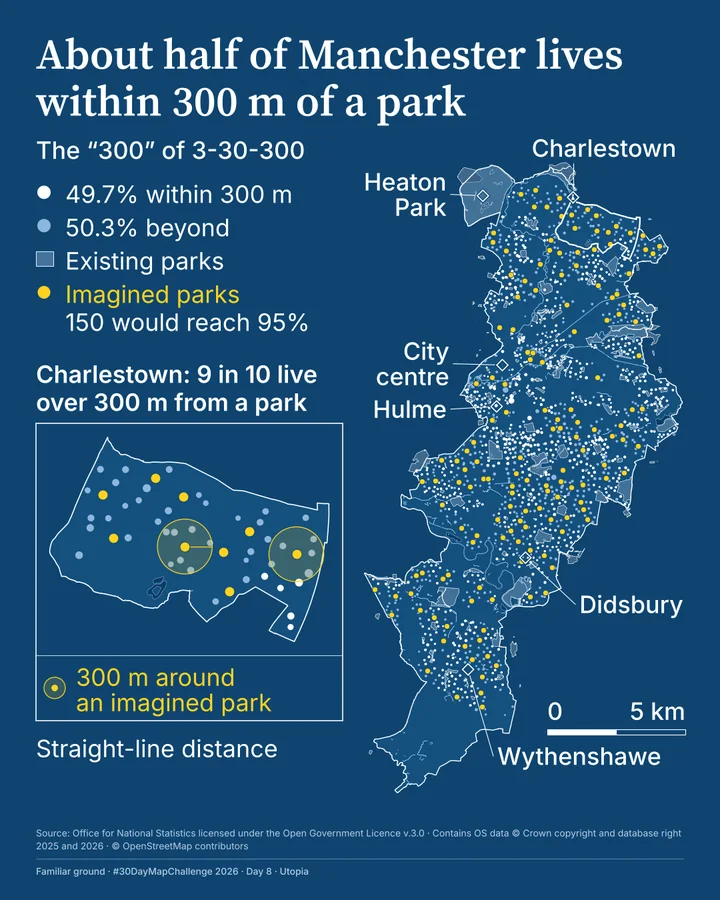
This map went through four designs on the same numbers. Green on grey looked like the map before it. A blueprint was striking but hard to relate to real life. Place names and the Charlestown inset fixed that, and the final poster uses yellow for the imagined and green for the real.
The hexagons are imagined locations, not park boundaries. Adding each one where it reaches the most people gets to 95% with 150 locations, but that is neither a minimum nor a feasible plan.
Heaton Park is the contrast that matters. It is the biggest mapped park, and about 1,000 residents live within 300 m of a way in.
On the way here
Earlier designs, same numbers
Method
How it was made
I measured straight-line distance from each census area's population-weighted centre to the pedestrian entrances of the 200 sites OS Open Greenspace records as Public Park Or Garden, using park edges for six parks with no recorded entrance. Whole census areas count in or out. Across five alternative ways of counting, the share runs from 37.1% to 66.5%, which is not a full range of uncertainty.
Limits
What this cannot tell you
This tests proximity to a mapped park, not the walk, park quality or every kind of green space. Distances are straight lines to mapped entrances. About one resident in ten, 9.8%, lives within 30 m of the 300 m line. The 300 m is the '300' of Cecil Konijnendijk's 3-30-300 guideline; I count mapped public parks and gardens as its public green space.
Next
What I’d do next
I would test this against what people in Charlestown would call a park, walk some of the routes, and try alternative zoning, which I did not test here.
Read my learning logData and credits
Sources
Data were filtered, joined and re-symbolised by me.
- Parks · OS Open Greenspace
- Contains Ordnance Survey data © Crown copyright and database right 2026.Open Government Licence v3.0
- Water · OS VectorMap District
- Contains Ordnance Survey data © Crown copyright and database right 2026.Open Government Licence v3.0
- ONS Wards (May 2026)
- Source: Office for National Statistics licensed under the Open Government Licence v.3.0; contains OS data © Crown copyright and database right 2026.Open Government Licence v3.0
- Place names and positions
- © OpenStreetMap contributorsOpen Database Licence
- ONS Local Authority District boundary
- Source: Office for National Statistics licensed under the Open Government Licence v.3.0; contains OS data © Crown copyright and database right 2025.Open Government Licence v3.0
- ONS output-area population-weighted centroids
- Source: Office for National Statistics licensed under the Open Government Licence v.3.0.Open Government Licence v3.0
- Census 2021, TS001 population counts
- Source: Office for National Statistics (Census 2021, TS001), licensed under the Open Government Licence v.3.0.Open Government Licence v3.0
- The 300 m guideline
- Konijnendijk, C.C. (2023), Journal of Forestry Research 34(3), 821-830, https://doi.org/10.1007/s11676-022-01523-z.Cited work
My map design and text: Creative Commons Attribution 4.0 (CC BY 4.0). Source data retain the licences above. Every source across the series is on the credits page.