Day 09 / Urban-rural / Great Britain
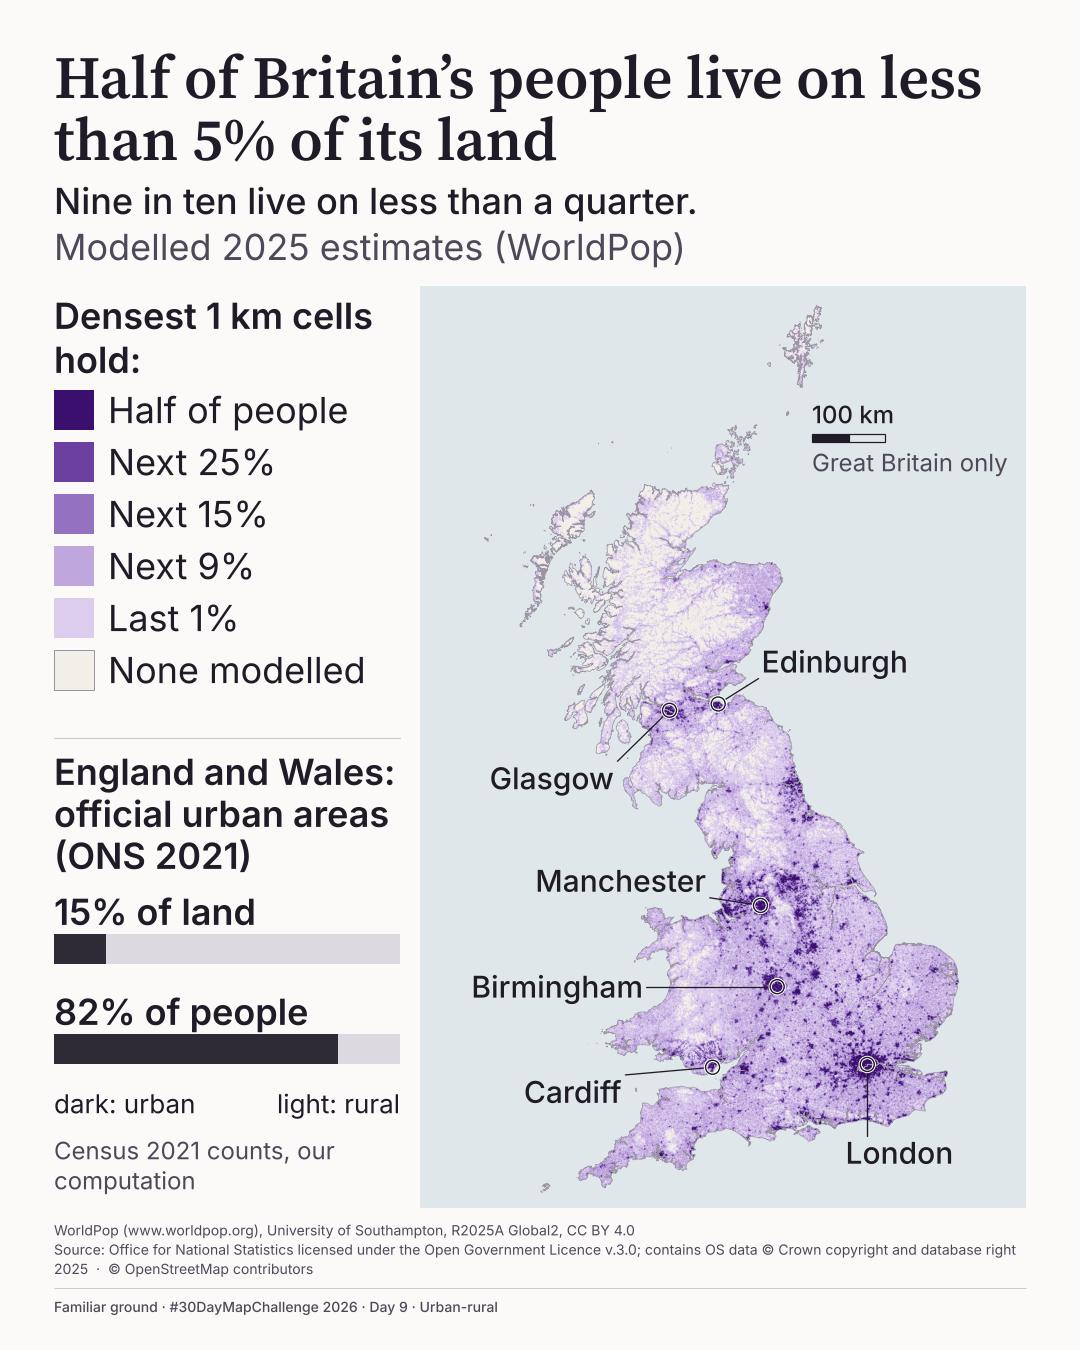
Half of Britain's people live on less than 5% of its land
Nine in ten live on less than a quarter.
How concentrated are Britain's people?
 Enlarge
Credits: WorldPop (CC BY 4.0); ONS and OS (OGL v3.0); OpenStreetMap contributors. Full sources
Less than 5%
of the land holds half of Britain's people
Less than a quarter
holds nine in ten
15% and 82%
of land and people in England and Wales official urban areas (Census 2021, my computation)
The thinking
What I tried and why
The risk with this theme was a map that says cities are dense and nothing more. So I changed the question from where to how much: rank every 1 km square, group by share of people held, and let the deepest violet be the first half of the people.
A single violet ramp on pale land, with the sea in its own panel so the land can stay pale. Labels sit in open sea with leaders, so nothing covers the data.
The film makes the same point in time. The land goes dark, then the squares light one after another, most crowded first, and two counters show the people racing ahead of the land.
Plate 09 in motion
Two films
The 50% and 90% shown in the film and the loop are shares of counted people. They leave out coastal part-land squares, which hold 2.75% of people; of all GB people those states equal 48.6% and 87.5%. With 1 km squares the land shares shrink to 2.6% and 10.9%, so the safe statement is half of us on less than 5% of the land and nine in ten on less than a quarter. The heights are heavily exaggerated: read them as shape, not measurement. The final visual and methods checks on the film were done by its director, not independently.
9AThe land fills up
35 seconds · silent · press play to start
Light up Britain one square at a time, starting with the most crowded, and watch how fast the people run out.
Text description of this film
A silent 35-second animation of Great Britain, drawn in 5 km squares on a pale blue-grey sea, labelled "Modelled 2025 estimates (WorldPop)". It opens with the most crowded squares lit in violet and the words "Half of Britain lives on these squares." The land goes dark, then the squares light one after another, most crowded first, while two counters climb: 50% of the people at 4.3% of the land, then 90% of the people at 22.9%. The last one in ten light up across more than three quarters of the land, through the Highlands, mid Wales and rural England. The map then tilts and rises into a violet relief with heights showing people per square kilometre, peaks at London, Birmingham, Manchester, Glasgow, Edinburgh and Cardiff. It ends on "Nine in ten of us, on less than a quarter of the land."
9BThe loop
15 seconds · silent · loops until paused · press play to start
A cut of the most striking part of the film, made to loop: dark Britain, the squares lighting, the people standing up.
Text description of this film
A silent 15-second loop cut from the longer film, using the same numbers and credits. Great Britain, unlit, against a pale sea, with the words "Now light every square, most crowded first." Squares light in violet from the most crowded while counters for people and land climb together. "Now stand the people up", and the map rises into a violet relief of heights, before returning to the start.
Method
How it was made
I summed WorldPop's 2025 modelled population to 1 km squares across Great Britain, with a 5 km version as a sensitivity test, and ranked the squares from most to least crowded. Half the people need 3% to 4% of the land and nine in ten need 11% to 23%, depending on the variant. So the map says less than 5% and less than a quarter, which hold in every variant tested. The comparison with official urban areas in England and Wales is my own computation from Census 2021 and the ONS Rural-Urban Classification. WorldPop's API v3 was used to cross-check national totals only.
Limits
What this cannot tell you
These are modelled estimates, not a headcount. WorldPop's R2025A is a first public release that may change, and national totals are tied to the UN World Population Prospects 2024, not the census. The GeoTIFF's embedded tags say R2024B v1 while the file name, URL, API and catalogue say R2025A v1; I use R2025A. Inland water is not removed from the land. Scotland is not part of the England and Wales urban comparison.
Next
What I’d do next
I would check with WorldPop about the R2024B tag, remove inland water properly and see whether the film survives LinkedIn's own transcode on a real phone.
Read my learning logData and credits
Sources
Data were filtered, joined and re-symbolised by me. The film adds no new data and shows 2025 only.
- Population · WorldPop Global2 R2025A v1
- WorldPop (www.worldpop.org), University of Southampton, R2025A Global2, CC BY 4.0. Bondarenko M., Priyatikanto R., Tejedor-Garavito N., Zhang W., McKeen T., Cunningham A., Woods T., Hilton J., Cihan D., Nosatiuk B., Brinkhoff T., Tatem A., Sorichetta A.. 2025 Constrained estimates of 2015-2030 total number of people per grid square at a resolution of 3 arc (approximately 100m at the equator) R2025A version v1. Global Demographic Data Project - Funded by The Bill and Melinda Gates Foundation (INV-045237). WorldPop - School of Geography and Environmental Science, University of Southampton. DOI:10.5258/SOTON/WP00839CC BY 4.0
- Urban and rural classification and boundaries
- Source: Office for National Statistics licensed under the Open Government Licence v.3.0; contains OS data © Crown copyright and database right 2025.Open Government Licence v3.0
- Census 2021 populations
- Source: Office for National Statistics (Census 2021, TS001), licensed under the Open Government Licence v.3.0.Open Government Licence v3.0
- City names and positions
- © OpenStreetMap contributorsOpen Database Licence
My map design and text: Creative Commons Attribution 4.0 (CC BY 4.0). Source data retain the licences above. Every source across the series is on the credits page.